

A Fan at Two Speeds
How does the spectrum of the same fan change as its speed increases? Compare two microphone recordings made at the same position and use the laser pulses as an independent reference for blade passage.
Data and test conditions
Download the fan_tu Dataset manually
Download all five parts to the same folder. On Linux or macOS, run this command in that folder to reconstruct the file for import into GX-TXT.
for n in 01 02 03 04 05; do
  unzip -p "signal-analysis-fan-tu-parte-$n.zip" "fan-tu-parte-$n.bin"
done > fan_tu.gxtxt-dataset.zip
SHA-256 09a28904a8f104a9b04357a46850d14236e0c6a77bdbc60adde1624a396be311
Simon Jekosch and Ennes Sarradj, TU Berlin, Dataset from a microphone arraymeasurement of a rotating fan (2021), CC BY 4.0. The fan has five blades and a diameter of 800 mm. Both runs were recorded on October 23, 2019, in an anechoic chamber, with the array at 1.21 m, the same GRAS 40PL-1 Short CCP microphone, and none of the setup modifications described in the protocol. The reported temperatures are 20.9 and 21.0 °C. Record, DOI and license · Protocol and test table
| Fan setting | HDF5 file | Microphone | Laser |
|---|---|---|---|
| 40% | 2019-10-23_10-57-15_767607.h5 | mic_40 | trigger_40 |
| 100% | 2019-10-23_11-30-27_924582.h5 | mic_100 | trigger_100 |
The excerpt takes the microphone from zero-based channel 0 and the laser from channel 63 of time_data, from sample 256,000 inclusive to 460,800 exclusive. time_s preserves the original times from 5 s to just under 9 s in each recording. Each series has 204,800 rows sampled at 51,200 Hz. The recordings are independent, and the excerpt covers a run with stable intervals between laser pulses. The HDF5 amplitudes were retained without filtering, gain adjustment or calibration. Values are on the original file’s numerical scale.
Compute both Welch spectra
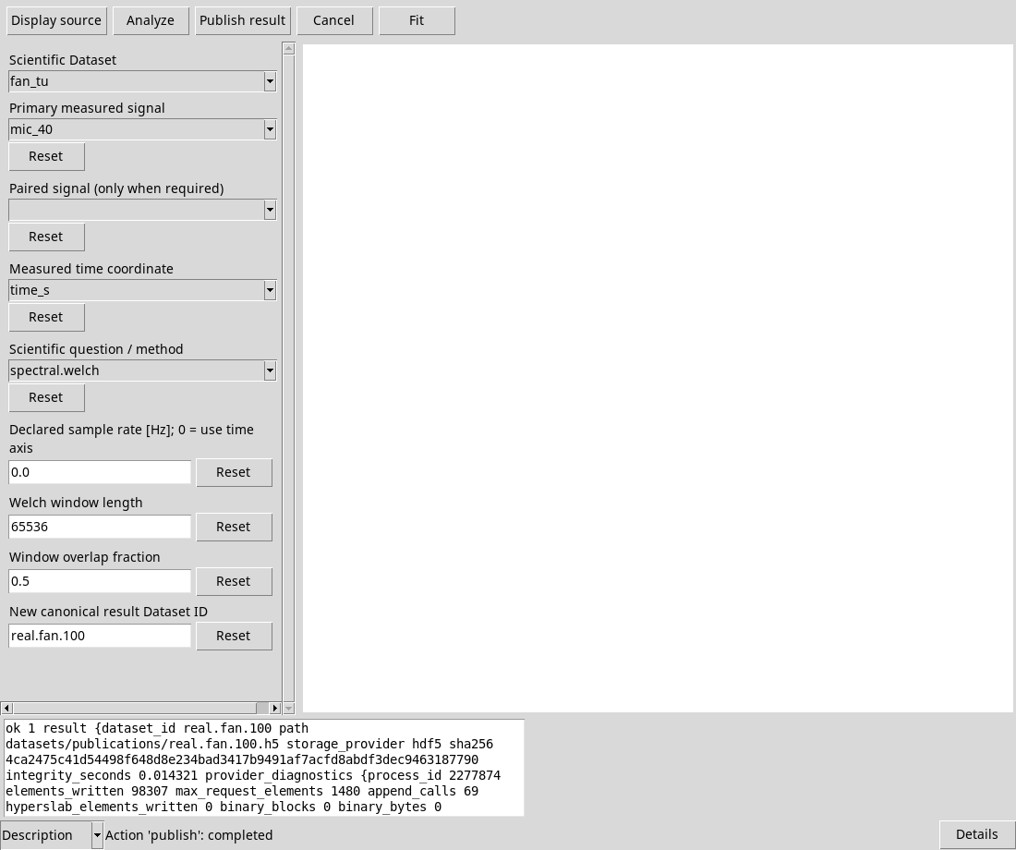
- Import the package into the Session and open Signal Analysis. Choose
fan_tu, setmic_40as the primary signal andtime_sas the time coordinate. Leave Paired signal blank and the declared rate at0. - In Scientific question / method, choose
spectral.welch. Set Welch window length to65536and Window overlap fraction to0.5. Click Analyze. Check that the summary shows 204,800 rows,measuredsampling and 51,200 Hz. - Set New canonical result Dataset ID to
real.fan.40and click Publish result. Repeat Analyze and Publish withmic_100and a different ID, for examplereal.fan.100. Allow several tens of seconds for computation and publication. Open the results as a Plot v4 plot or a canonical table.
The Hamming window is 1.28 s long and advances in steps of 0.64 s. The average uses five complete overlapping segments, covering 196,608 of the 204,800 rows read. With a 65,536-point FFT, the bin spacing is 0.78125 Hz. The actual peak width depends on the window, duration and signal.
Distinguish rotation from blade passage
On each laser channel, find rising crossings of 35, between the resting level and the pulse level. Count one rising edge per revolution and divide 51,200 by the median interval between edges, in samples. Multiply the result by 60 for rpm or by 5 for the blade-passing frequency. The two excerpts contain 49 and 70 rising edges, respectively.
| Fan setting | Median interval | Rotation rate | Speed | Expected blade passage | PSD peak |
|---|---|---|---|---|---|
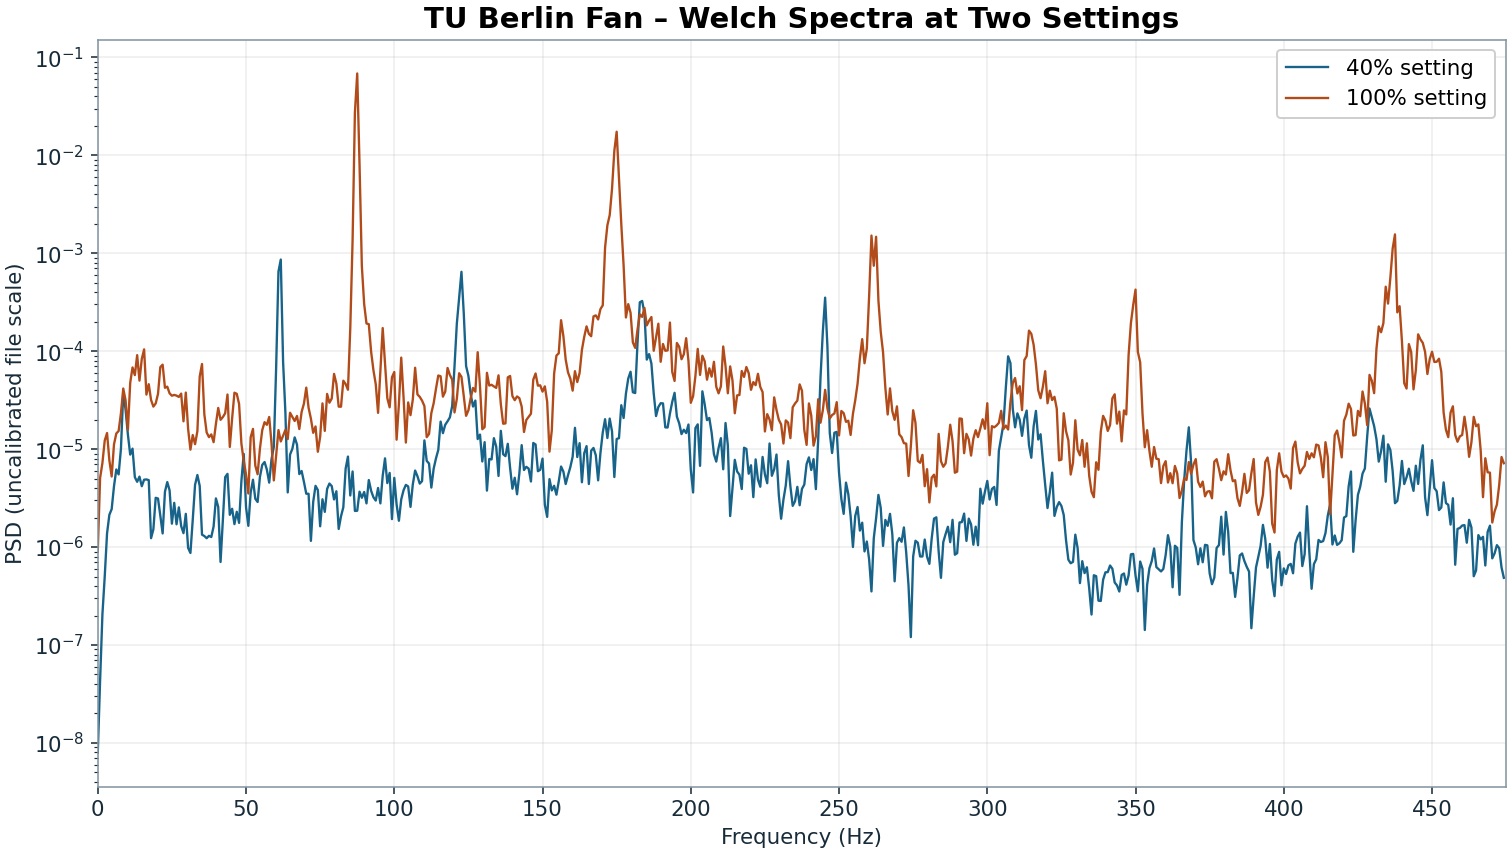
| 40% | 4,171.5 samples | 12.274 Hz | 736.4 rpm | 61.369 Hz | 61.719 Hz |
| 100% | 2,929 samples | 17.480 Hz | 1,048.8 rpm | 87.402 Hz | 87.500 Hz |
Both peaks are within half a bin of the expected blade-passing frequency. At 100%, another peak is visible at 175 Hz, close to twice the blade-passing fundamental. On the file’s numerical scale, the maximum PSD rises from about 8.62 × 10⁻⁴ to 6.85 × 10⁻². The comparison uses maxima in different bins with the same Welch settings. The values 40% and 100% are fan control settings. The speeds in rpm come from the laser. This comparison covers the two recordings with the fan running. No fan-off background level is available for the selected windows, and the PSD is uncalibrated, so it cannot be read as dB SPL.
Data, excerpts and derived results are attributed to Simon Jekosch and Ennes Sarradj. CC BY 4.0