

Acoustic Decay in Two Rooms
Compare the acoustic decay in two spaces using the same channel selection, preparation and time windows. Both series are impulse responses obtained from sweep recordings and deconvolution.
Two OpenAIR measurements
- Ron Cooke Hub, University of York
fsfr.wavfrom theb-formatfolder. First source and receiver positions, 12.6 m apart, at heights of 1.5 and 1.2 m. The four-channel, 96 kHz, 24-bit PCM file is 1 s long. The logarithmic sweep runs from 20 Hz to 20 kHz and lasts 60 s. The documentation describes combining responses from four source orientations. Recorded on March 5, 2018, by Elias Baxter, Dy’Anna Augustus-Hinkle, Julian Cefai and David Szalai. OpenAIR record and license · WAV metadata- Jack Lyons Concert Hall, University of York
rir_jack_lyons_lp2_96k.wavfrom theb-formatfolder. The source is at the center of the orchestra and the receiver at seat D22 in the center of the stalls, 10 m apart, at heights of 1.5 and 1.2 m. The four-channel, 96 kHz, 16-bit PCM file is 4 s long. The 50 s logarithmic sweep covers 20 Hz to 22 kHz, with responses from four source orientations combined. Recorded on March 27, 2017, by Alex Duffell, Aishwarya Sridhar and Zhong Li, AudioLab. OpenAIR record and license · WAV metadata
Use the first channel of each B-format WAV without spatial decoding. In each file, time zero is the first sample whose absolute value reaches 10% of the channel’s absolute peak. This alignment reference depends on the threshold. The zero-based source indices are 3,524 and 3,593, at about 36.71 and 37.43 ms. Copy 76,800 samples (0.8 s) from each starting point without resampling. Divide each trace by its absolute peak in the first 50 ms after alignment. ron_rel and jack_rel are therefore dimensionless relative amplitudes. time_s starts at zero for both.
Compute the envelopes
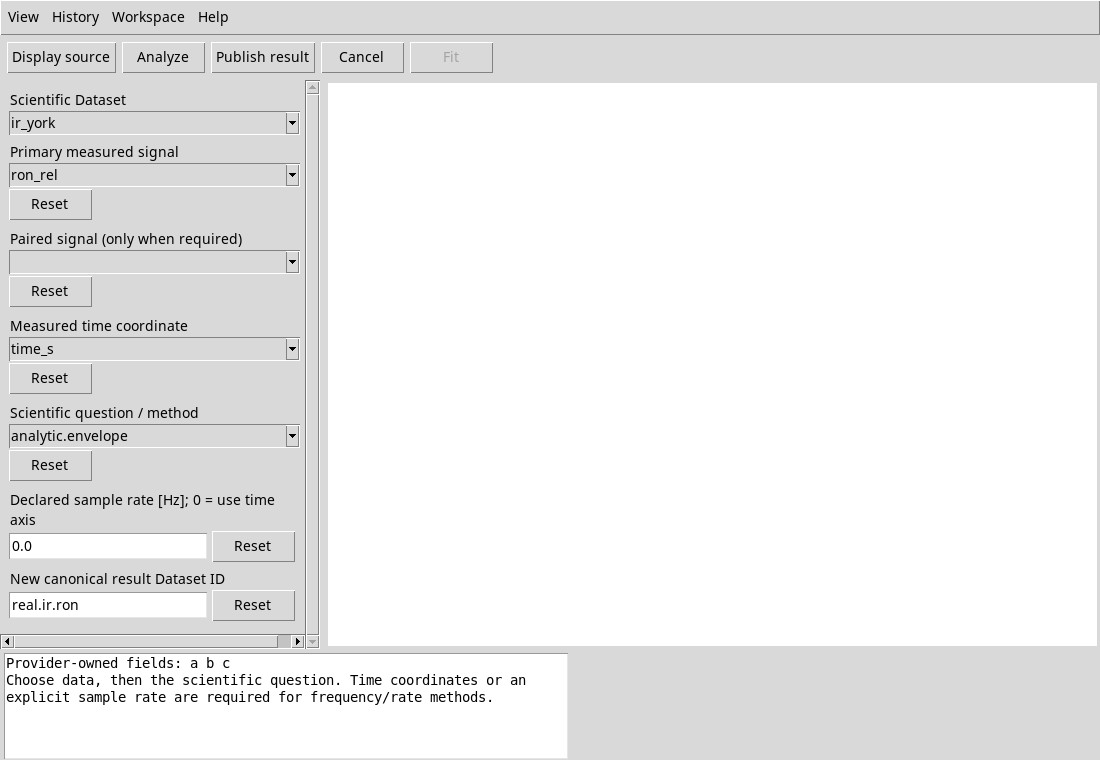
- Import the package and choose
ir_yorkin Signal Analysis. Setron_relas the primary signal andtime_sas the time coordinate. Leave the paired signal blank and the declared rate at0. - Choose
analytic.envelopeand click Analyze. Check for 76,800 rows and a sample rate of 96,000 Hz. The operation returnstime_secondsandamplitude, the magnitude of the analytic signal obtained using the Hilbert transform. - Publish with an unused ID, for example
real.ir.ron. Repeat withjack_relandreal.ir.jack. To open the tables and plots, follow the procedure for viewing the published result.
Compare the tails using the same metric
For each envelope, compute RMS in the same time windows, then compare it with the RMS of that envelope’s initial [0, 0.05) s window. The relative level is 20 log₁₀(window RMS / reference RMS) in dB. Each window contains 4,800 samples. Include the start time and exclude the end time.
| Window | Ron Cooke Hub RMS | Ron relative dB | Jack Lyons RMS | Jack relative dB |
|---|---|---|---|---|
| [0, 0.05) s | 0.4415 | 0.00 | 0.2016 | 0.00 |
| [0.25, 0.30) s | 0.0918 | −13.64 | 0.0601 | −10.52 |
| [0.60, 0.65) s | 0.0168 | −28.39 | 0.0179 | −21.05 |
In these windows, the relative level is lower in the Ron Cooke Hub. Between 0.60 and 0.65 s, for example, the level drops by about 28.4 dB in the Ron Cooke Hub and 21.1 dB in the Jack Lyons Concert Hall. Each ratio is relative to the start of its own response.
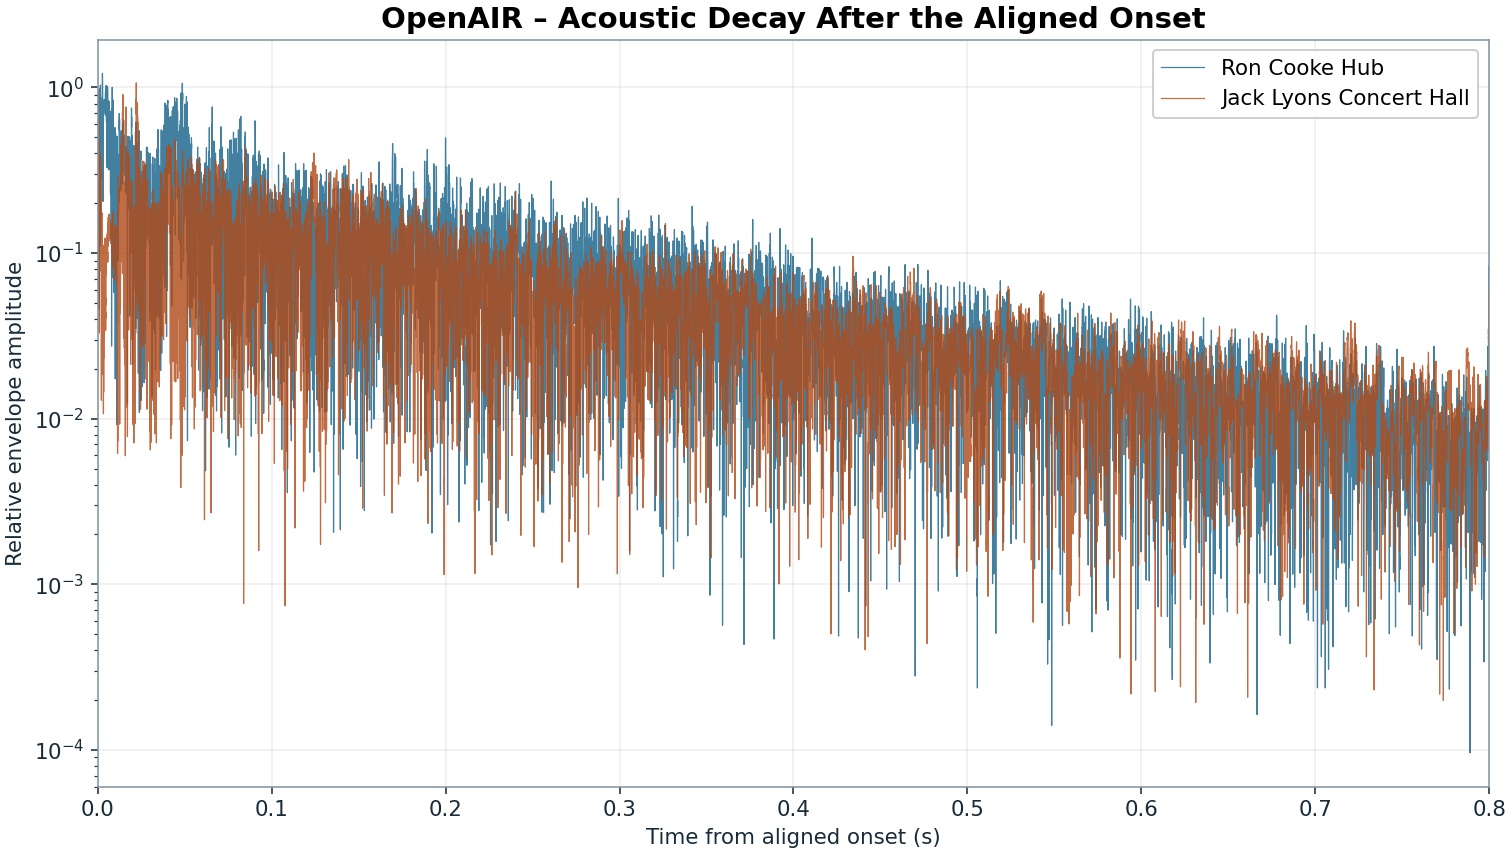
The comparison uses recordings at two specific positions with levels normalized to internal references. The figures describe the three selected windows. Estimating RT60 requires a dedicated procedure and decay interval. Also consider the sensitivity of the Hilbert envelope to the edges of an excerpt. The WAV files come from the OpenAIR measurement campaigns at AudioLab, University of York, with credits listed above. CC BY 4.0