Compare and Navigate Spectra
Five plot modes, axes, pointer coordinates, zoom and pan.
Choose a comparison mode
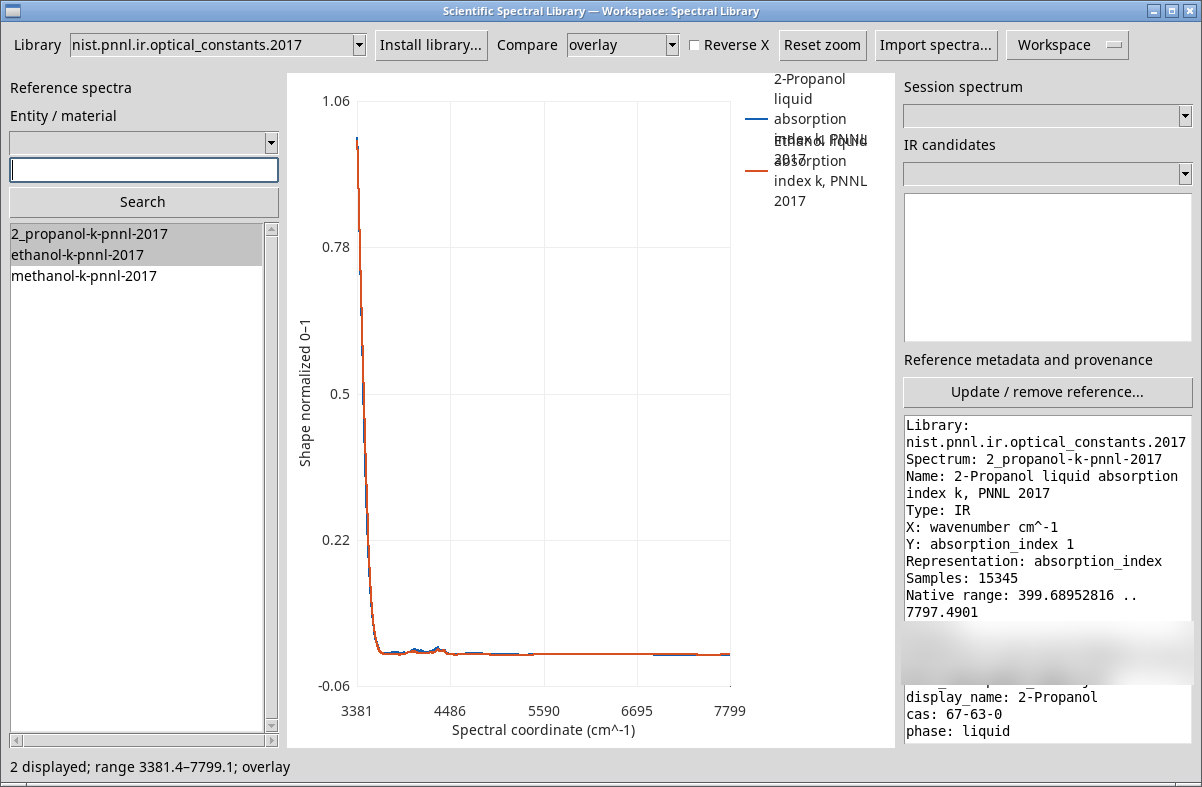
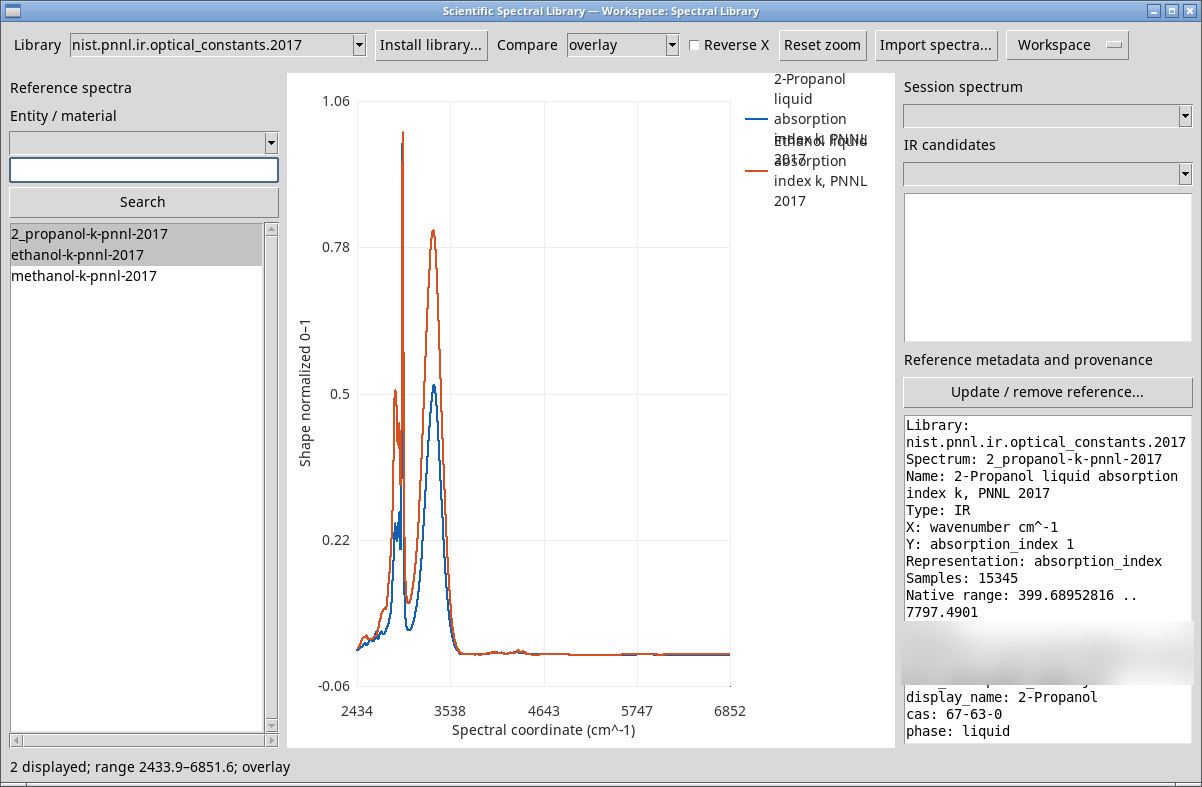
Select spectra in the left pane, then set Compare. The default is overlay. List order determines which reference comes first. Check the axes and legend, particularly when adding a Session Dataset.
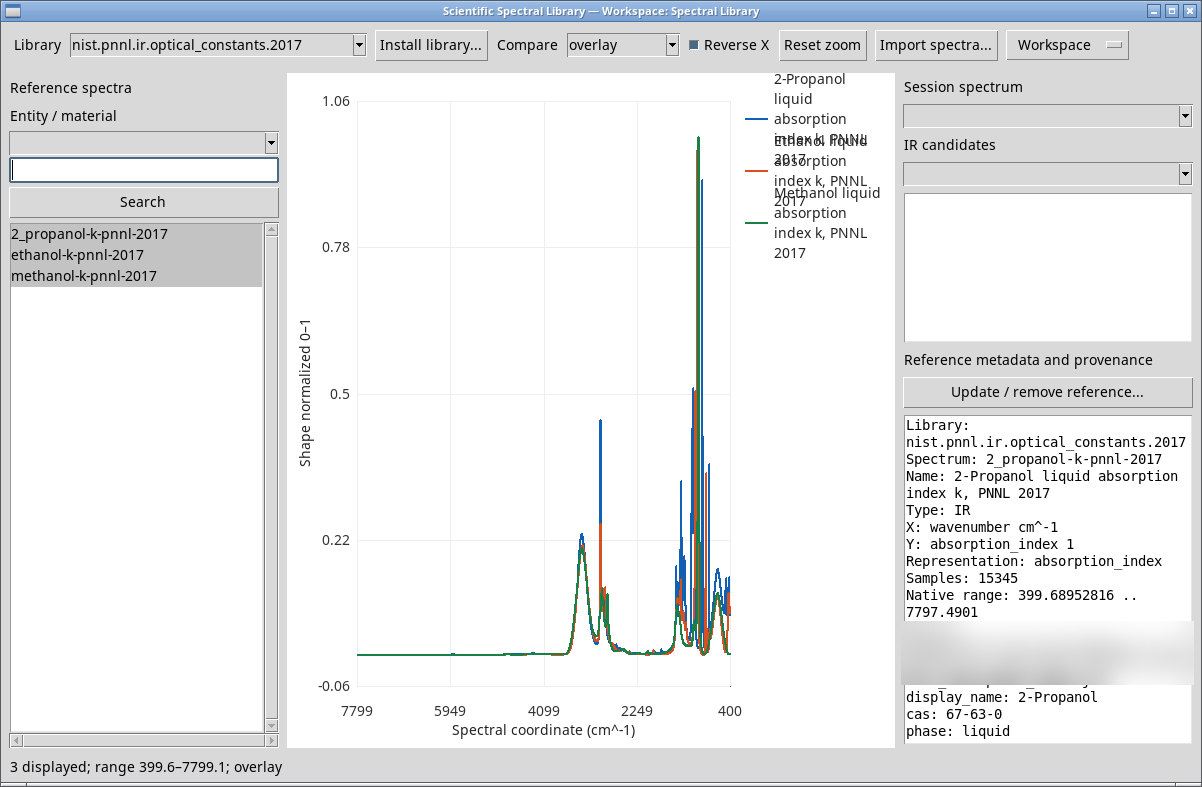
- overlay
- Overlays the curves. With multiple curves, it normalizes each shape to the range 0–1. The X units and Y representations must match. A single curve retains its native Y values.
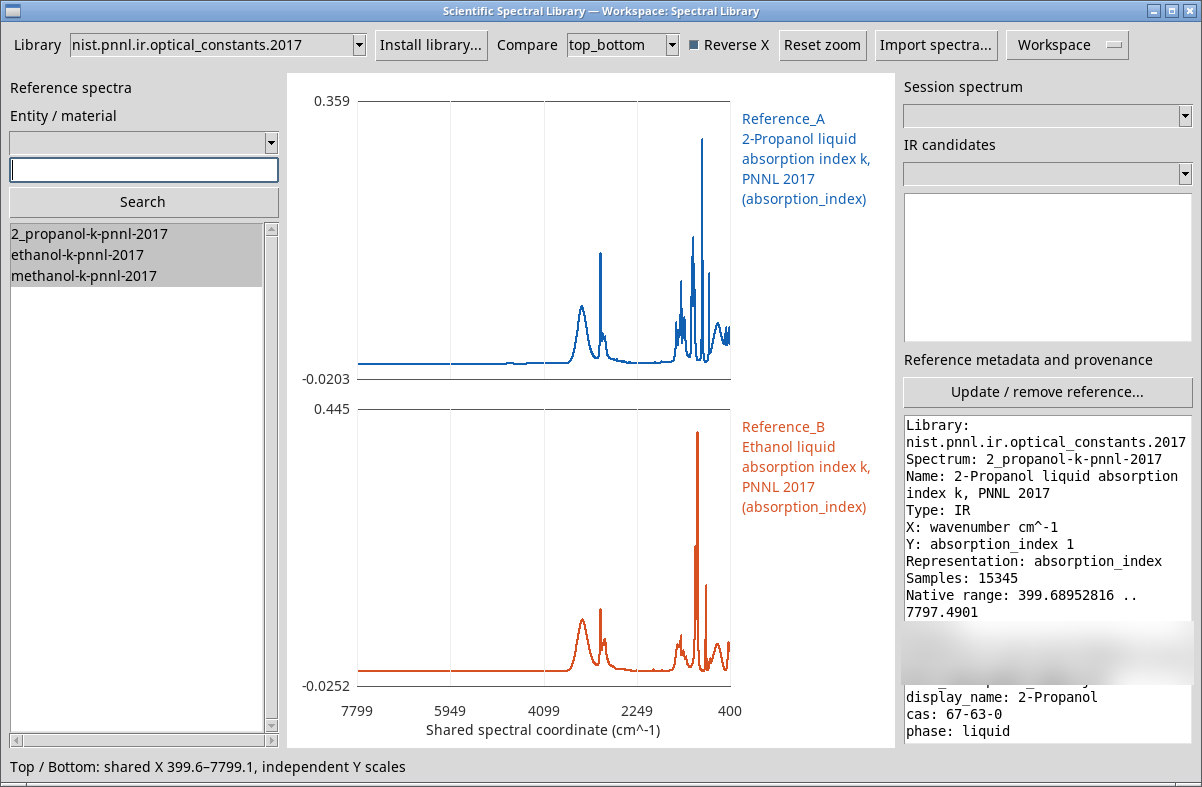
- top_bottom
- Shows two panels with a shared X axis and independent Y axes. With a Session Dataset and references, it displays Experimental above the first Reference. Without a Dataset, it uses the first two references, Reference_A and Reference_B. This mode needs two curves with comparable X coordinates.
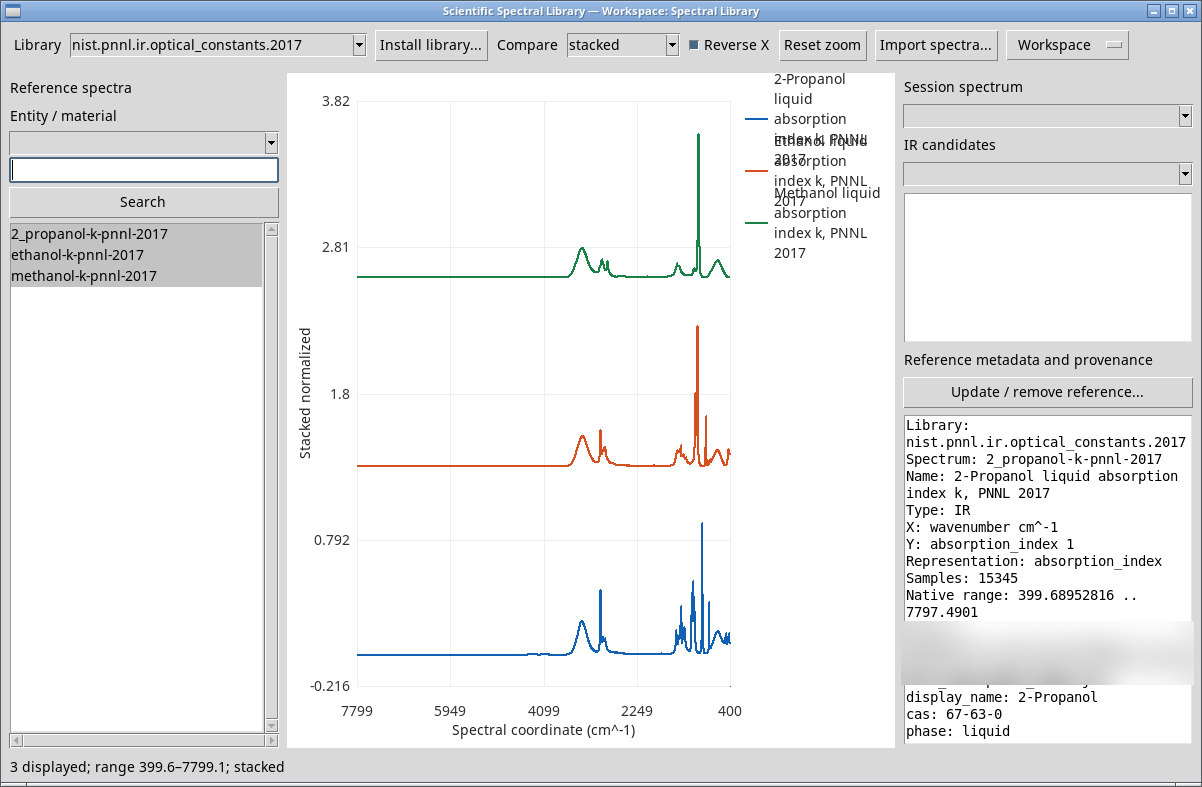
- stacked
- Normalizes the curves and separates them with a vertical offset. Read
Stacked normalizedon the Y axis and use the order of the bands. - difference
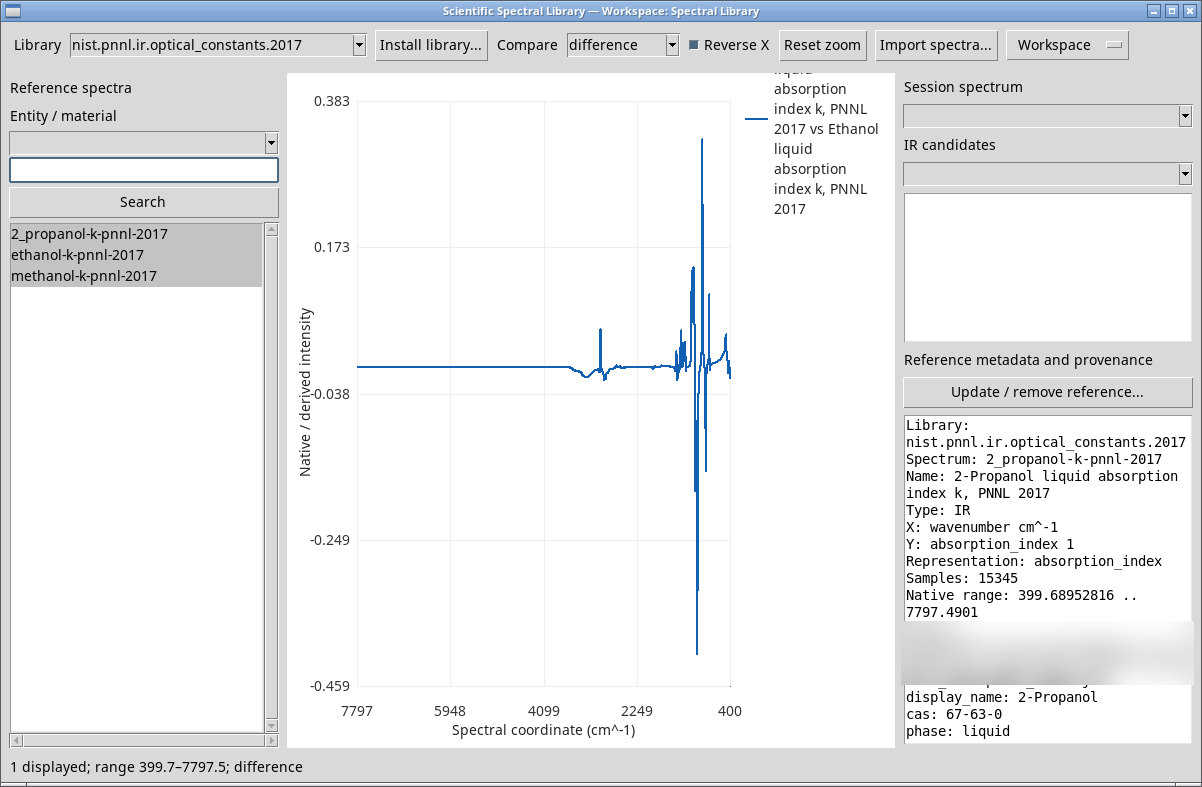
- Shows the first curve minus the second. It linearly interpolates the second onto the first curve’s grid over their common range. The coordinates and representations must be compatible.
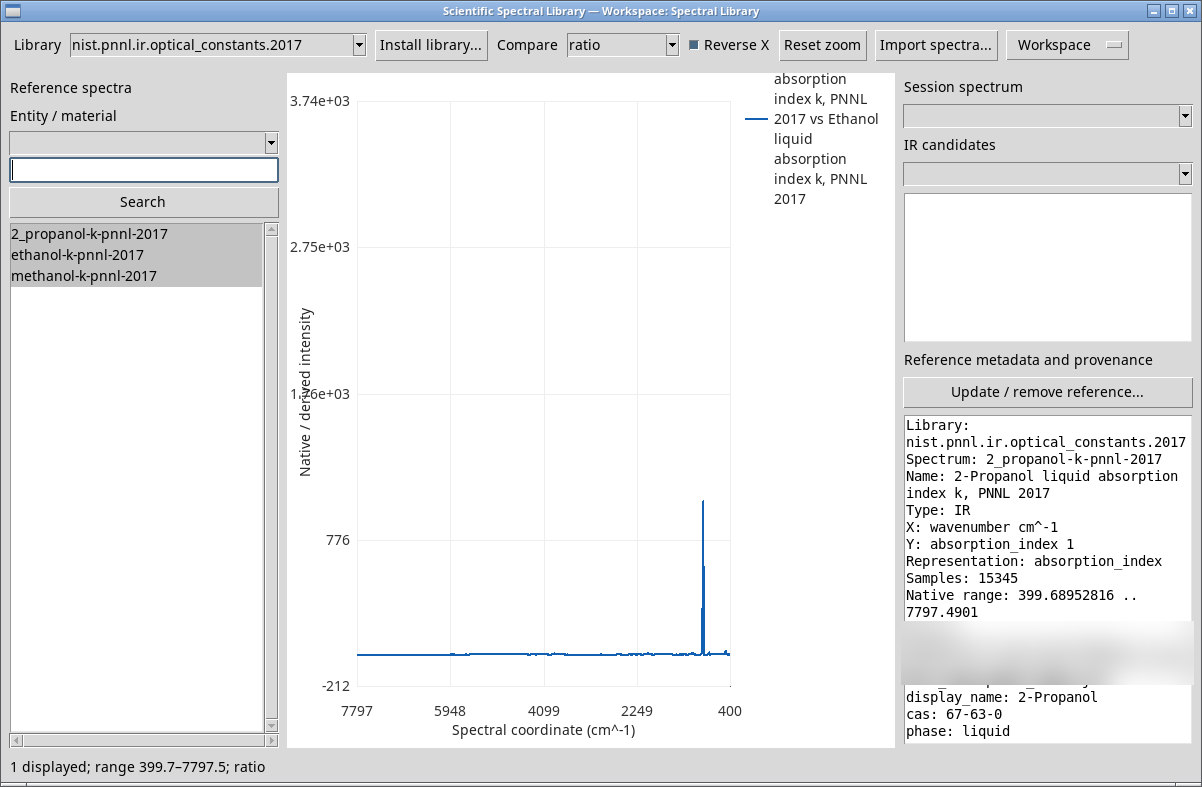
- ratio
- Divides the first curve by the second after the same alignment. It omits points where the denominator’s magnitude is at most
10⁻¹². Check extreme peaks near a small denominator.
With one curve, difference and ratio show its original plot. With incompatible axes or Y quantities, the viewer may report Overlay requires comparable X and intensity semantics or Difference/ratio requires equal coordinate and intensity semantics. Use top_bottom for different Y quantities when X coordinates are comparable. Check each record’s X quantity and unit first. In this release, top_bottom and stacked can plot a curve in cm⁻¹ alongside one in nm using the first curve’s label with no conversion. In that case, read them separately or prepare coordinates in the same units first. Without shared points, the operation reports No common spectral range.
Read coordinates and adjust the range
Reverse X is selected initially, with the highest wavenumber at the left. Clear it for ascending order. Move the pointer over the plot to read Cursor in the status bar. The value is the pointer’s X coordinate in the axis units. Scroll to zoom the X range around the pointer. After zooming, drag horizontally with the left mouse button to pan. Press Reset zoom to restore the full domain.