

ELEC · Practical Guide 06 — Overlay observations and predictions in Curve Viewer
Compare seven nitrogen observations at 100 rpm with two predictions, then save the editable Curve Viewer workspace separately from the published graph.
ELEC project · Practical GX-TXT guide 6 of 16.
Reproduction target: GX-TXT DEV112-P013. The original screenshots and recorded results document the historical ELEC session. A rerun on P013 has yet to be verified.
Module: Curve Viewer
Learning objective: Overlay observations and predictions in Curve Viewer
Prerequisites / input: Seven 100 rpm N centres and two fit Datasets
Expected output: Editable overlay and separately published graph
Scientific background and reference results
An overlay shows where a prediction follows or misses data at observed times. The graph combines existing sources: it does not perform a fit or make a prediction an observation. This historical example concerns the N response at 100 rpm.
Step-by-step procedure
- Open Curve Viewer → New 2D in the Session copy. Use Add source… → Choose canonical Dataset and choose
hal_fig3b_100rpm_seven_interior_unweighted.measurement_1.curves, withxandyas coordinates. - Separately add Fitter outputs
hal_fig3b_assay_hp_100rpm_calibrationandhal_fig3b_assay_hl_100rpm_calibration_011, choosingfitted_xandfitted_yfor both. Check units and nitrogen basis before placing sources on the same axis. - Choose
scatterfor observed centres and distinguish H_P and H_L predictions with clear legends and styles. Usescatterfor predictions at the seven observed times too, without implying interpolation. - Check times and the displayed range; add a title and units distinguishing observation from conditional transfer. Use Save Workspace to retain the editable configuration.
- Use Publish Plot → Create new Graph with a new ID and save the Workspace again. Historical product
plot.dataset.xy/p0019compares seven observations and two conditional fits at the same times.
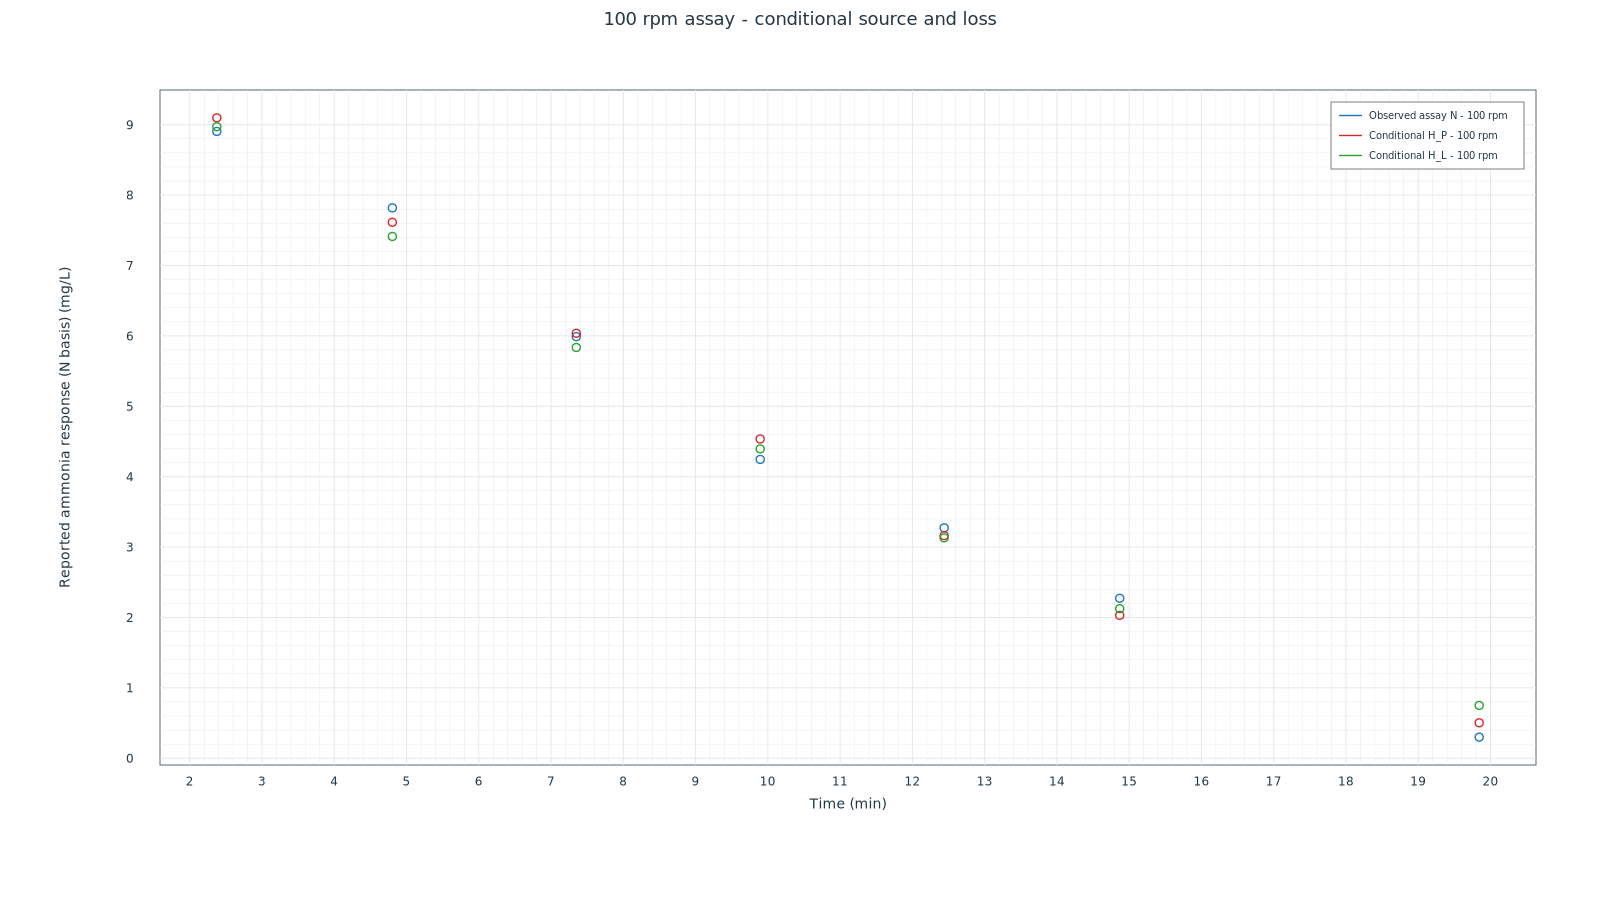
Agreement alone does not identify a mechanism. Retain Datasets, configuration and assumptions with the graph; an exported image alone does not retain editable sources. P013 is NOT_RUN.
Working materials
Figure 3 digitized datasets (CSV) · Model and constraint datasets (CSV)
Other steps of this project
- ELEC 02 — Model hierarchy: effective kinetics, transfer and identifiability
- ELEC 03 — From fits to constraints: what does the chlorine balance reveal?
- ELEC 01 — What does the experiment measure? Nitrogen, chlorine and pH
- ELEC 07 — Sources, conclusions and tests that could distinguish the mechanisms
- ELEC 04 — Kinetics, speciation and transport: from local reaction to reactor response
- ELEC 06 — Where the numbers came from: GX-TXT, GNU Octave and reproducibility