

ELEC 01 — What does the experiment measure? Nitrogen, chlorine and pH
Why does the ammonia-related signal fall more slowly at higher stirring rates? We examine what the nitrogen and chlorine assays measure and what bulk pH and electrode transport can tell us.
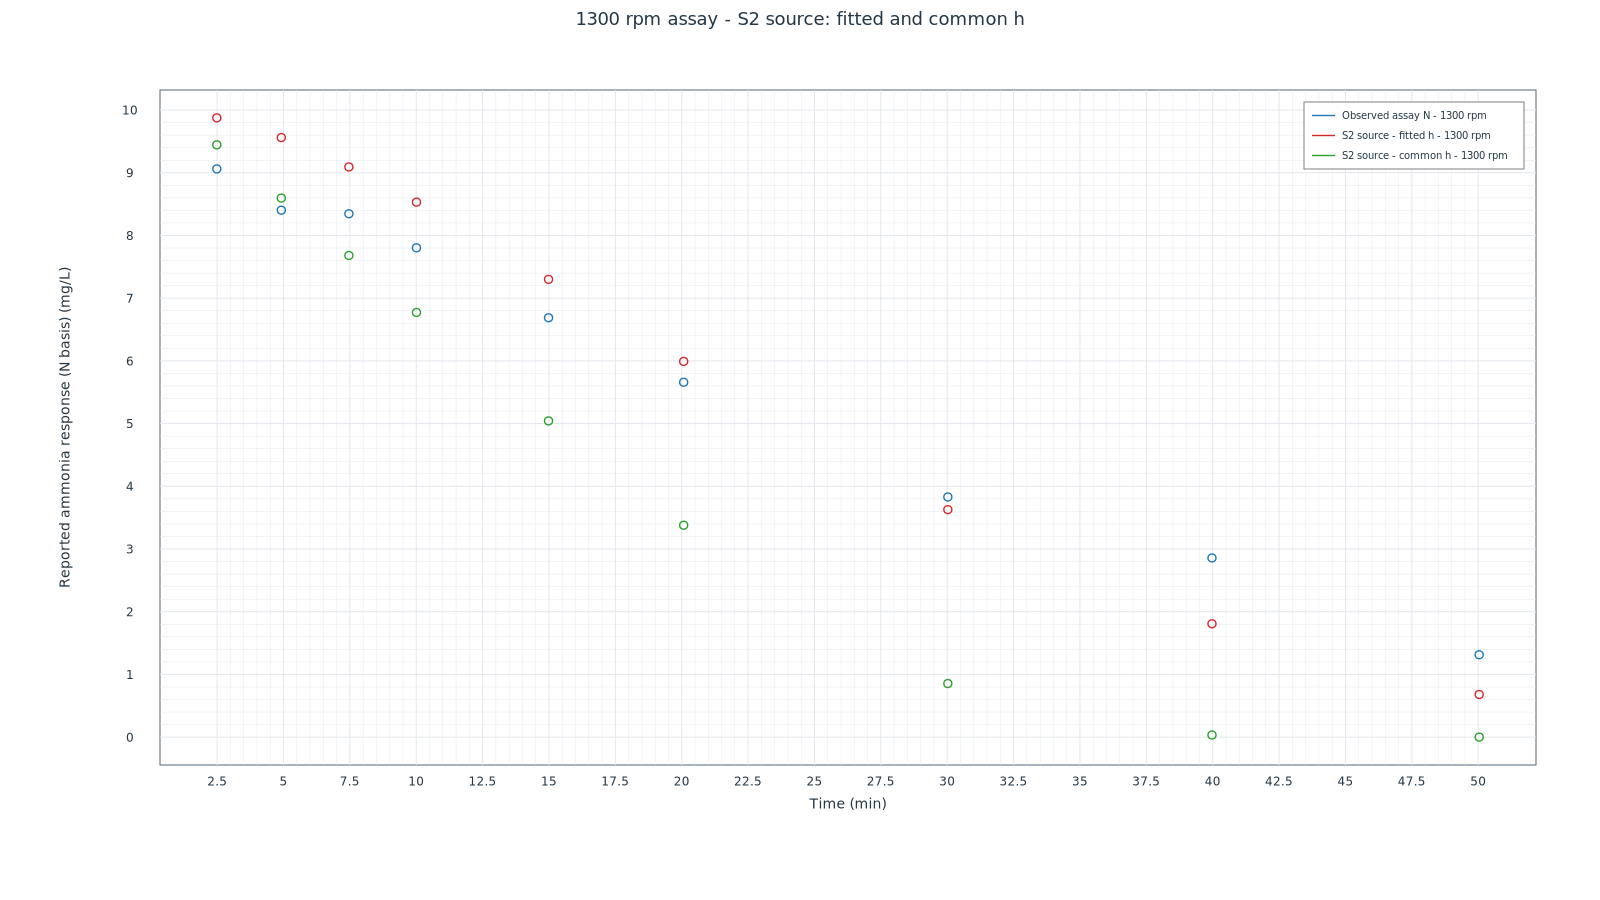
Figure 3 of Atrashkevich et al. compares 0, 100, 500 and 1300 rpm. The dataset analyzed here comes from a stirred 200 mL beaker with a Ti/IrO₂ anode, a current of 0.12 A and, in nitrogen-present trials, a nominal initial concentration of 10 mg N/L. The experiment lasted 60 minutes. Panels a–d report the nitrogen signal and bulk pH. Panels e–h report the chlorine channels.
| Observable | Method and units | What it constrains |
|---|---|---|
| Nitrogen signal | TNT830, mg N/L | Response attributed to ammonia/ammonium and inorganic chloramines |
| Free chlorine | DPD at 530 nm, without iodide, mg Cl₂/L | Operational free chlorine in the nitrogen-present trial |
| Total chlorine | DPD at 530 nm, with iodide, mg Cl₂/L | Free and combined chlorine. The nitrogen-free control constrains oxidant accumulation |
| Monochloramine | Indophenol at 655 nm, mg Cl₂/L in the figure | A channel distinct from total minus free DPD chlorine |
| Bulk pH | Measurement in the liquid | Proton activity in the sample at the time of measurement |
The stirring effect reported by Atrashkevich and colleagues is interesting because several observables change together. The response called ammonia declines more slowly at high rotation speed, while chlorine accumulation in the nitrogen-free control also changes. Explaining only the nitrogen curve risks assigning an oxidant-availability effect to nitrogen kinetics. Explaining only chlorine can neglect the analytical response and transformations of the nitrogen pool. A useful explanation must accommodate both families under compatible assumptions.
An assay is an observation operator
The authors describe TNT830 as including ammonia/ammonium and contributions from inorganic chloramines. The retained manufacturer information does not independently calibrate recovery of each species in this experimental matrix. The state of the liquid and the measured signal must therefore be distinguished. If cᵢ denotes species concentrations in mol N/m³ and ρᵢ dimensionless recovery factors, a schematic operator is
Its units are g N/m³, numerically mg N/L. Recovery incorporates sample preparation and analytical response; the mass basis is explicitly carried by M_N. No recovery factors were fitted. Identifying y_N/M_N with a model pool A requires the stated recoveries, rather than following from dimensional compatibility alone.
The operational model uses A in mol nitrogen atoms per cubic metre. Its link to the reported signal assumes a common proportional response for the included species. It does not prove that A is pure NH₄⁺, or that a decline measures gaseous nitrogen. Differences in chloramine recovery, dilution and the historical protocol remain analytical issues. These limitations do not retroactively invalidate the paper’s measurements. They specify what is needed to interpret them. Retained TNT830 scope.
The distinction is chemically decisive. NH₃+HOCl→NH₂Cl+H₂O retains one nitrogen atom in the liquid. If ammonia/ammonium and monochloramine are both recovered, rapid monochloramine formation does not remove the declared pool. Subsequent aqueous dichloramine or trichloramine formation may also leave nitrogen inside it. Loss of the actual pool requires conversion to excluded species or physical export; loss of signal may additionally involve recovery. These are different propositions.
The conservation statement concerns the homogeneous liquid inventory or its volume average. A sampled aliquot in a spatially heterogeneous reactor need not represent that average. Equal analytical recovery and representative sampling are part of the inference, not results of the kinetic fit. This matters when interpreting stirring or local electrode gradients.
What the Hach documentation establishes
Hach Method 10205 specifies a range of 0.015–2.00 mg/L NH₃–N for TNT830. The nominal initial concentration in the beaker exceeds this range for the aliquot presented to the assay. Suitable dilution can bring the aliquot within range. The reviewed methods do not document the dilution factor, the delay between sampling and reading, any preservation or quenching, or species-specific chloramine recovery in the matrix in sufficient detail. The consulted instructions are later editions or otherwise distinct from the historical protocol. No reported value was corrected on their basis.
Separating changes in chemical composition from measurement effects would require the aliquot procedure, dilution corrections, recovery tests for the species present, checks in the same matrix and the criteria for out-of-range samples.
Hach Method 10205: extended procedure DOC316.53.01081, instructions DOC312.53.94125 and note on out-of-range readings DOC042.53.00812.
Free chlorine, total chlorine and monochloramine
Figure 3 distinguishes total chlorine without nitrogen, free and total chlorine with nitrogen, and a separate monochloramine measurement. The source describes DPD at 530 nm, without/with iodide, for free/total chlorine; monochloramine is determined separately by indophenol at 655 nm. The chlorine-panel ordinate is mg Cl₂/L, including the monochloramine series. It is an oxidant-equivalent mass basis, not mg of NH₂Cl molecules. Total minus free cannot uniquely identify monochloramine or replace its dedicated channel.
The model’s B is mol Cl₂-equivalent/m³ of accessible oxidant. Relating it to chlorine in the nitrogen-free control is an explicit closure to examine. With chloramines present, B cannot simultaneously mean DPD free chlorine, DPD total chlorine and monochloramine. A more resolved interpretation must define which species contribute to each observation. Producing a numerical B trajectory does not establish that operator. Figure 3 observable map.
Physical units do not specify chemical mass bases. mg N/L and mg Cl₂/L both have dimensions of mass per volume, but comparison requires M_Cl₂/M_N and a declared stoichiometry. Likewise chloride ion is not free chlorine. Native calculations preserve units, chemical basis and constant provenance so that the numerical identity g/m³=mg/L does not become an identity of species.
What the acquired points represent
| Stirring speed | Nitrogen assay marker centers | Nitrogen-free total-chlorine control centers |
|---|---|---|
| 0 rpm | 6 | 9, also used as the reference control |
| 100 rpm | 7 | 9 |
| 500 rpm | 8 | 8 |
| 1300 rpm | 9 | 8 |
The four nitrogen-assay curves contain 6, 7, 8 and 9 selected marker centres at 0, 100, 500 and 1300 rpm. The newly acquired nitrogen-free chlorine controls contain 9, 8 and 8 points at 100, 500 and 1300 rpm. They reconstruct published markers, not the authors’ raw observations or independent replicates. Occluded or cropped centres were not invented. Partial nitrogen-present traces retain their exclusions and localization limits. A point near a plotting boundary does not become a zero or a zero upper bound.
At the freeze, the usable nitrogen-present chlorine acquisition comprises three free-chlorine centres and one total-chlorine centre at 100 rpm. Corresponding 1300 rpm centres have not been acquired. These partial traces are useful as partial evidence; a complete four-trace set is not a prerequisite for examining an available finalized subset. Their limited coverage must remain visible in tables and captions.
Published bars could add information if their meaning and identifiable endpoints were actually recovered. The current centre acquisition has not recovered those quantities. Figure 3 bar semantics and replicate count remain unknown: no SD, SE or CI is assigned. Digitization uncertainty is not the paper’s experimental dispersion. The SD values in supplementary Table S2 refer to summarized rates and cannot be transferred to individual nitrogen markers as weights.
For a possible displayed-range sensitivity calculation, uncertain cap membership would prevent assigning an endpoint at all. Even identifiable lower and upper caps would define a rectangular displayed-range scenario, not a confidence interval or guaranteed experimental bound. Correlations, timing uncertainty, analytical recovery and shared controls would still matter. No such combined uncertainty result is claimed here.
Independence, clocks and spatial scope
The nitrogen-free control constrains a model calibrated on nitrogen curves, but it remains part of the same published study. S2 and a curve possibly used to estimate a rate are not necessarily independent experiments. A newly published native overlay is an editable view of existing values, not an additional numerical solve. Fitter, a genuine Script/Job, Expression, Mathematics or Worksheet produce numbers; Curve Viewer compares and presents them.
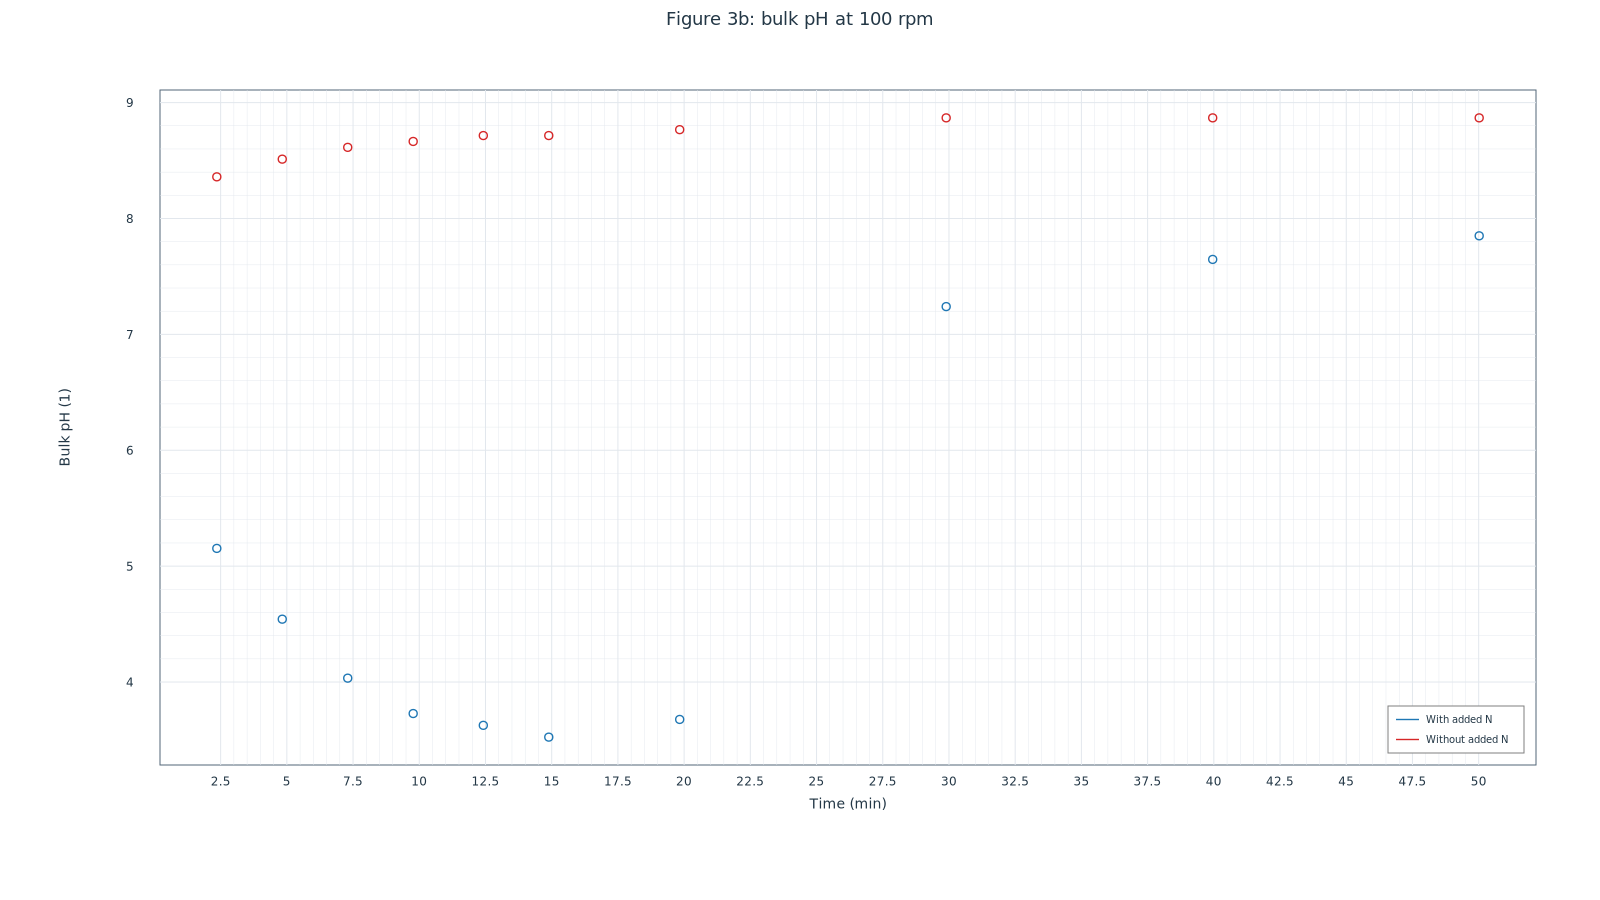
Bulk pH is another observable: it reports proton activity in the sampled liquid at its reading time, not interfacial pH at either electrode. The two acquired pH arrays happen to share selected image abscissae. This does not demonstrate synchronized raw sampling or paired aliquots. The original times and row identities are retained rather than replaced by a manufactured common grid.
Finally, FcMeOH/Pt limiting-current measurements probe transport in a distinct protocol. A tracer coefficient is not automatically a rate coefficient for reactive chlorine, ammonia or a coupled electrode boundary layer. Keeping assay, time, space and tracer identities separate is how multiple constraints become informative without being compressed prematurely into a single stirring constant.
Datasets
Original assay-N centres · Original nitrogen-free controls · Partial nitrogen-present chlorine · Two acquired pH traces
Digitized Figure 3 observations (12 CSV files in a ZIP archive)
Bulk pH, transport and the chemical mass basis
Here C and D are the tracer concentration and diffusion coefficient, S is electrode area, n is the number of electrons transferred, and F is the Faraday constant. The tracer test characterizes convection under its own electrode and solution conditions.
With a stated stoichiometry, ν gives moles of Cl₂ equivalent per mole of nitrogen atoms. The relation gives the theoretical oxidant demand. The molar mass Mₙ is 14.0067 g/mol.
Experimental source: Atrashkevich et al., Water Research 282 (2025), 123732, Figure 3, §2.3 and Table S2. DOI 10.1016/j.watres.2025.123732.
Other steps of this project
- ELEC 02 — Model hierarchy: effective kinetics, transfer and identifiability
- ELEC 03 — From fits to constraints: what does the chlorine balance reveal?
- ELEC 07 — Sources, conclusions and tests that could distinguish the mechanisms
- ELEC 04 — Kinetics, speciation and transport: from local reaction to reactor response
- ELEC 06 — Where the numbers came from: GX-TXT, GNU Octave and reproducibility
- ELEC 05 — Gas loss, chloramines and the proton balance