

Italian Prisons, Year by Year
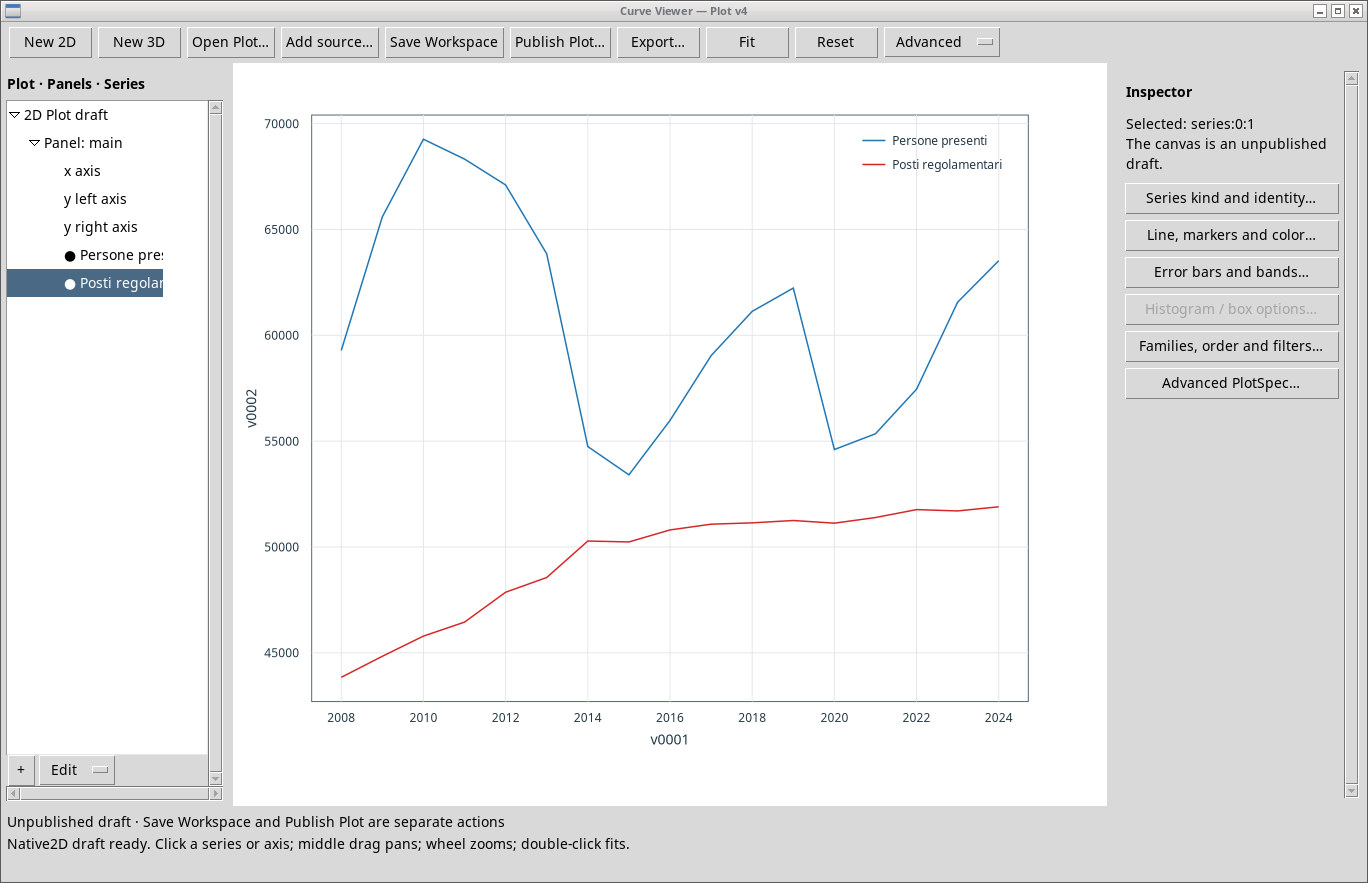
Between 2021 and 2024 the Eurostat series records 8,175 more people held in Italy. Over the same interval official capacity increases by 509 places.
Occupancy and capacity change at different rates
In 2010 there were 69,263 people for 45,791 places, about 151 per 100 places. By 2015 the excess had fallen to 3,171 people. It had risen again by 2019, before the drop of 2020. In 2024 it reaches 11,623 people. Reading the two series together helps to separate a fall in the number of people held from an expansion of capacity. Eurostat, crim_pris_cap.
Figure 1
The recent rise in four observations
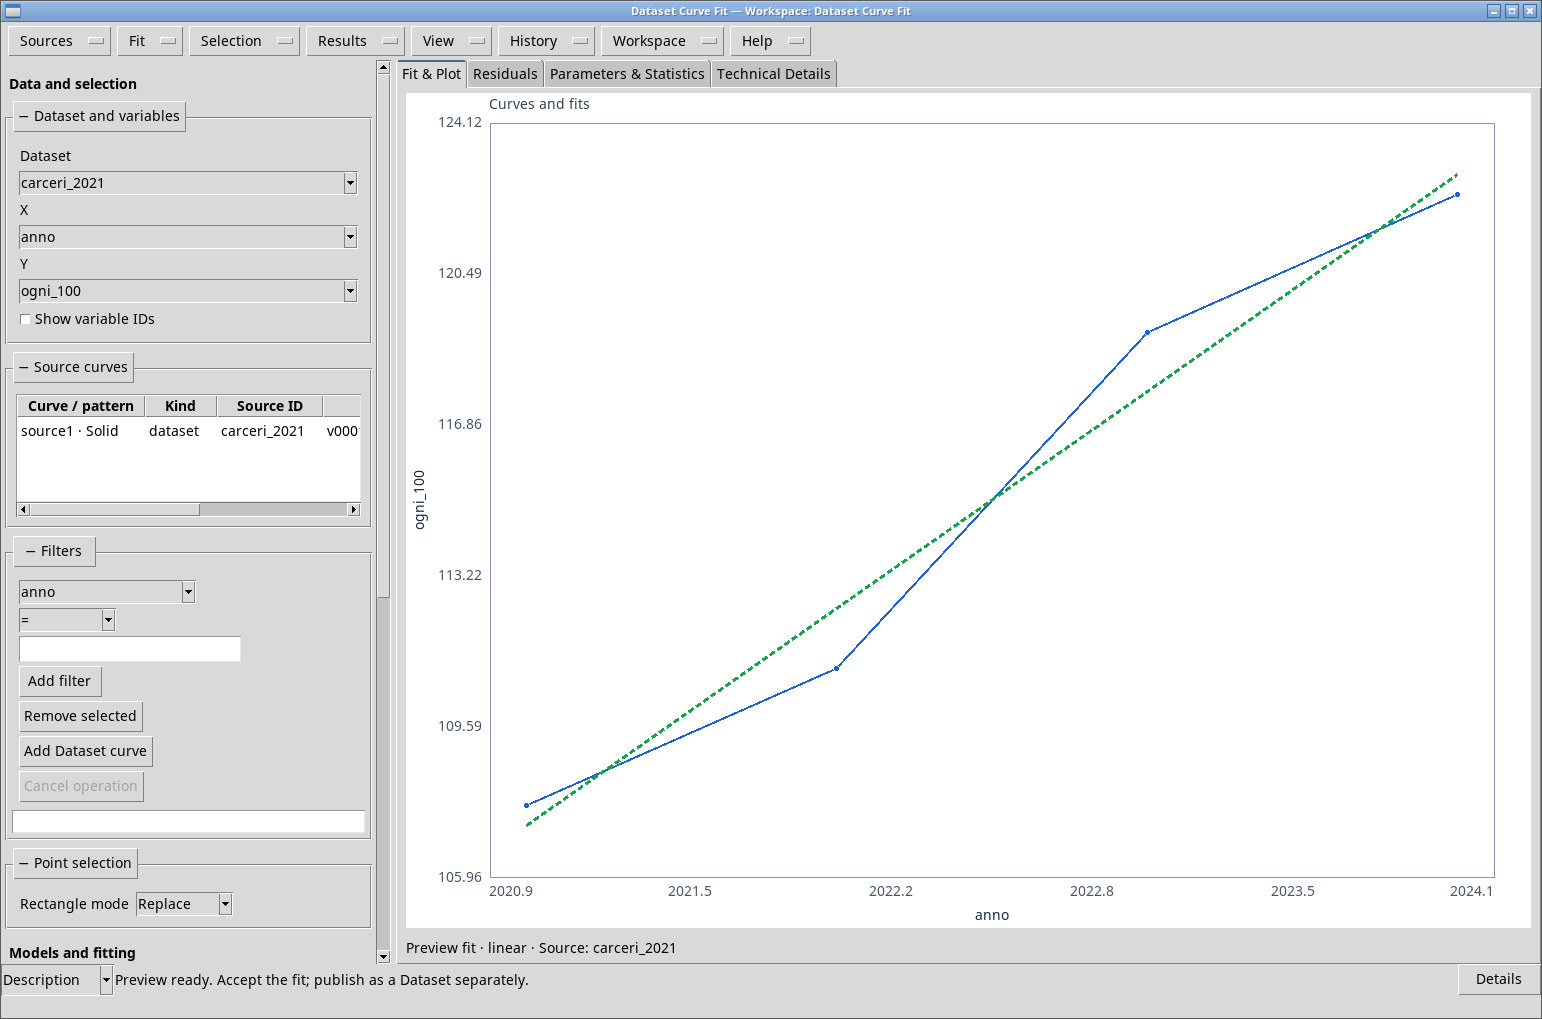
To describe the rise we fitted a line to the ratio of people to places from 2021 to 2024. Curve Fitter returns +5.22 people per 100 places per year, RMSE 1.07 and R² 0.967. The line summarizes the trend over the four chosen years. With four observations, R² mainly reflects how well the points align over a short interval, and extending the line to future years would be an unvalidated forecast.
Figure 2
What the count leaves out
A year-end snapshot describes the population present, while admissions and releases are flows. The length of stays can also change the number of people present. Studying the causes requires consistent series on flows, length of stay and criminal justice practice. Official capacity measures regulation places and can differ from operational availability. Eurostat metadata.
Data to reproduce the analysis
Prison Population · Data and Methods · Back to the five-studies project