

From the Coast to a Thousand Meters Deep
At the surface the three example cells differ by almost 2 °C. At a thousand meters the range across the same cells is less than 0.7 °C.
Reading the shape of the basin
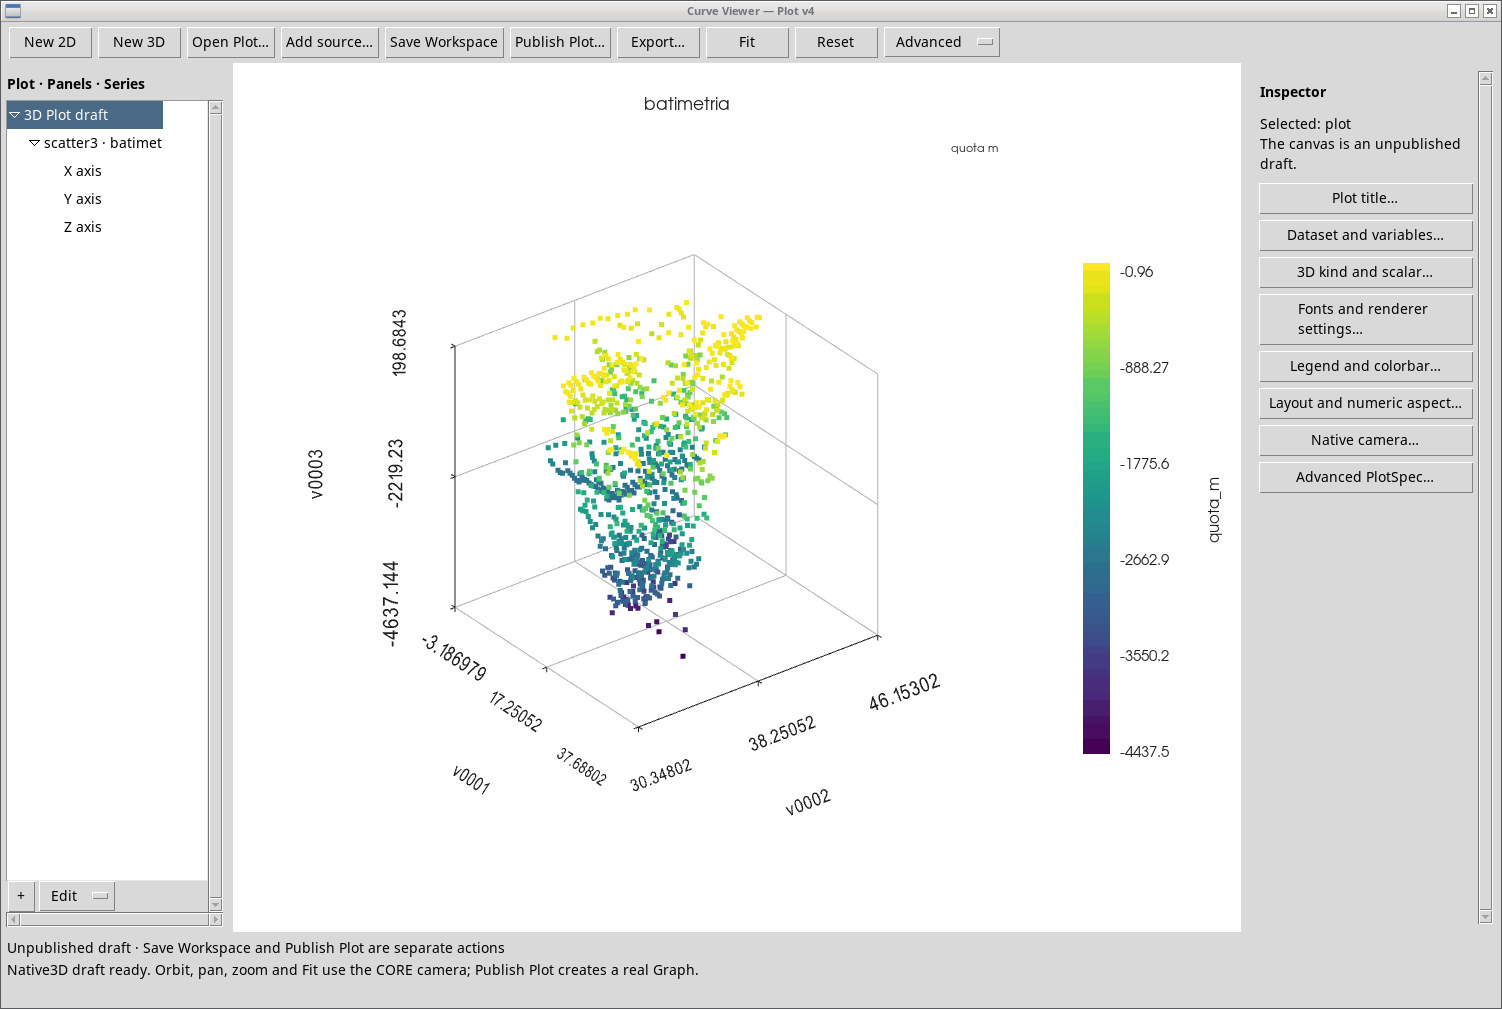
The EMODnet DTM 2024 bathymetric model gives elevations in meters relative to the product’s reference datum. Here we sampled the Mediterranean extract at a spacing of about half a degree and selected 920 marine points with negative elevation. In Curve Viewer the plot has longitude and latitude on the horizontal plane, elevation on the vertical axis and color mapped to elevation. The orthographic projection from above shows the extent of the sample and the layout of depths. It is a point-based plan view at teaching resolution. Navigation requires the official nautical charts. EMODnet, DTM 2024 metadata.
Figure 1
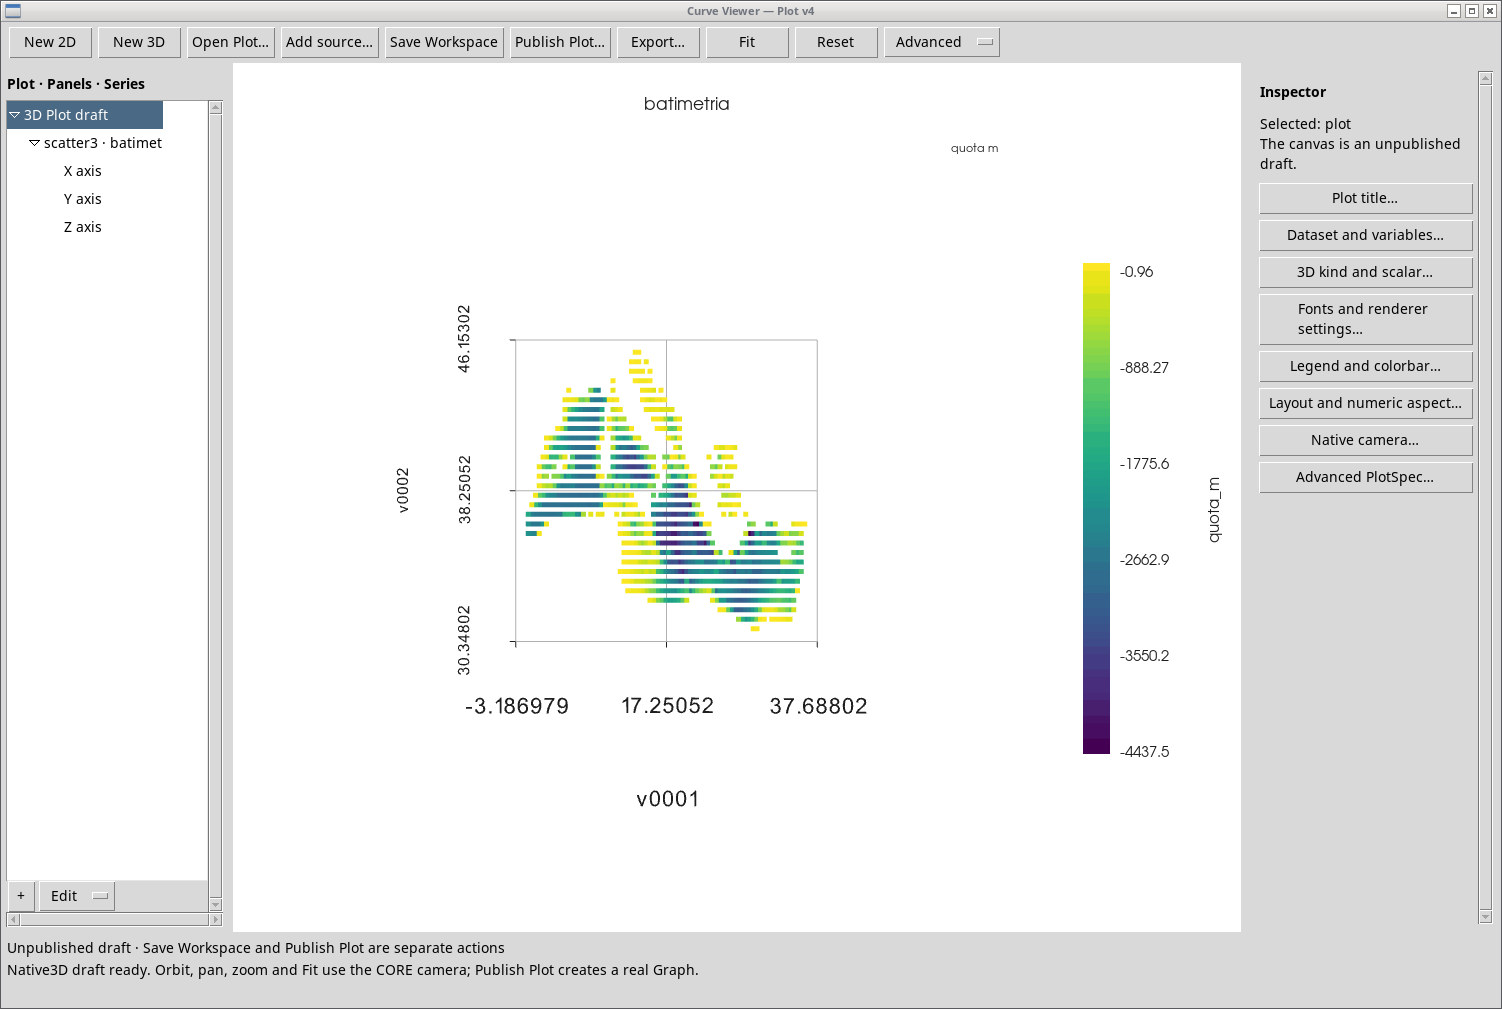
Figure 2
Temperature in three dimensions
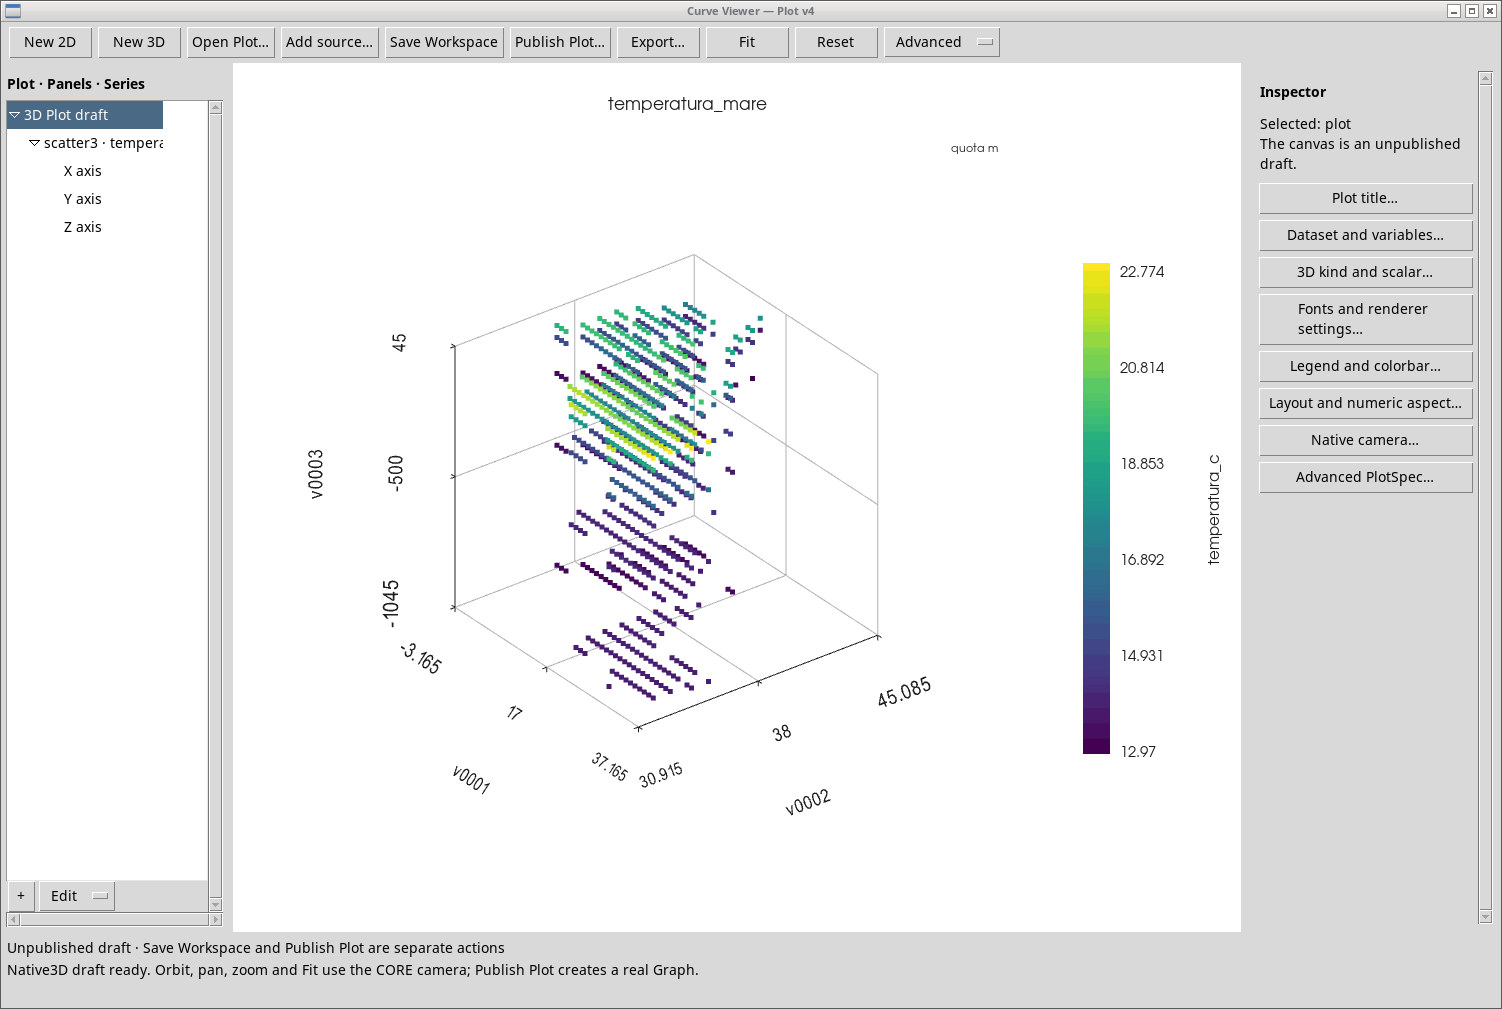
Figure 3 uses World Ocean Atlas 2023, the 1991–2020 annual climatology on a 1° grid. The Z elevation is zero at the surface and negative at depths of 50, 200, 500 and 1,000 meters. Color shows water temperature in °C. The field is a climatology interpolated from observed profiles. The plot shows the five sampled levels and the points available in each. NOAA, World Ocean Atlas 2023 – Temperature.
Figure 3
Three comparison profiles
| Depth | West, 4.5°E 38.5°N | Center, 18.5°E 36.5°N | East, 31.5°E 34.5°N |
|---|---|---|---|
| 0 m | 19.72 | 20.52 | 21.67 |
| 50 m | 16.01 | 16.72 | 17.83 |
| 200 m | 13.41 | 14.84 | 15.61 |
| 500 m | 13.32 | 14.12 | 13.98 |
| 1,000 m | 13.12 | 13.77 | 13.73 |
Figure 4
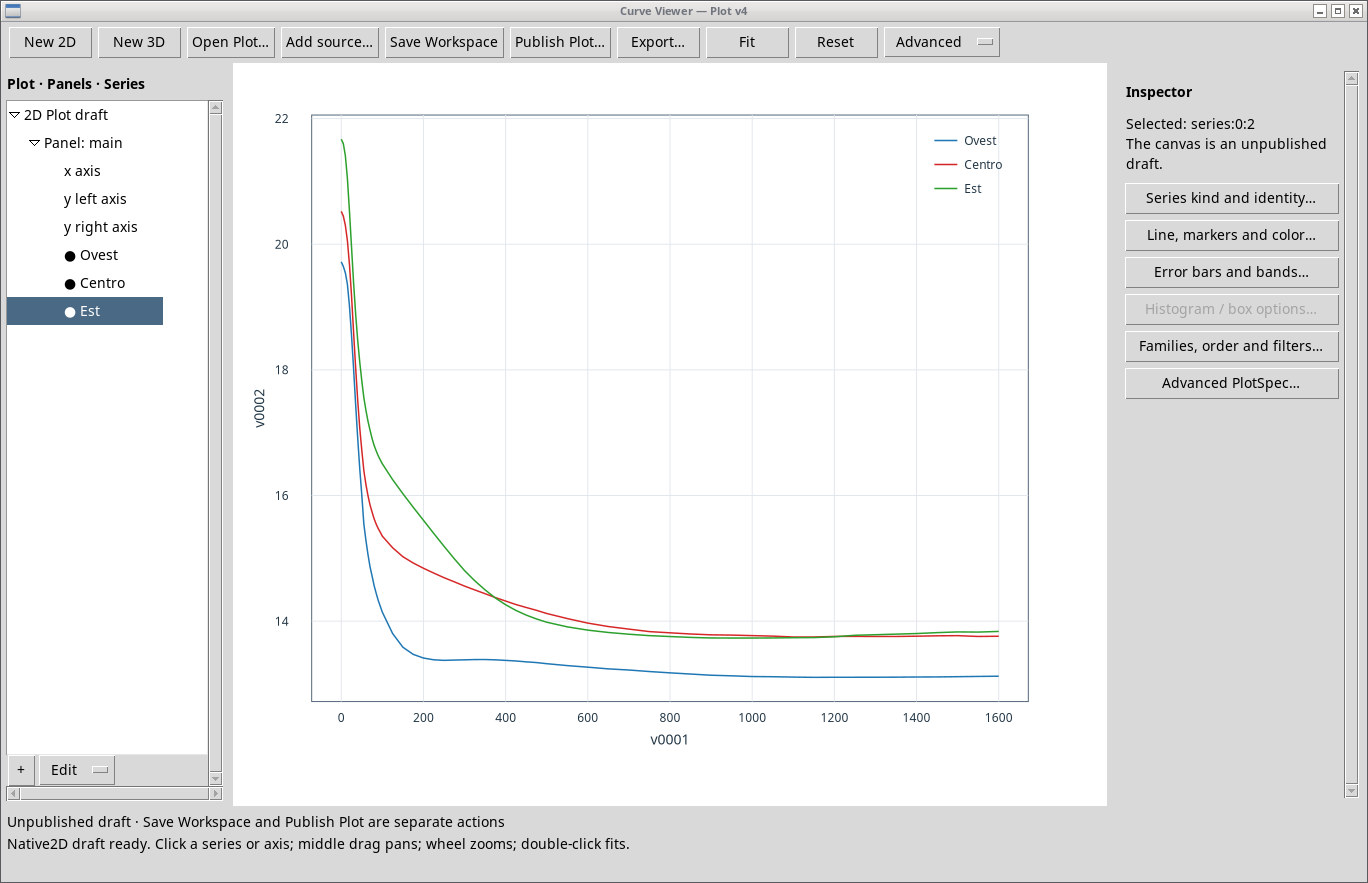
The drop between the surface and 200 m is steeper than the gradient observed over most of the rest of these profiles. The annual mean shape integrates seasonal variations. The century-long surface series and this vertical climatology answer different questions. Warming of deep waters over a hundred years would require consistent series along the whole water column.
Data to reproduce the analysis
Mediterranean and Climate · Data and Methods · Back to the five-studies project