lesson 07 octave

All gallery images with Media Library metadata and download links.

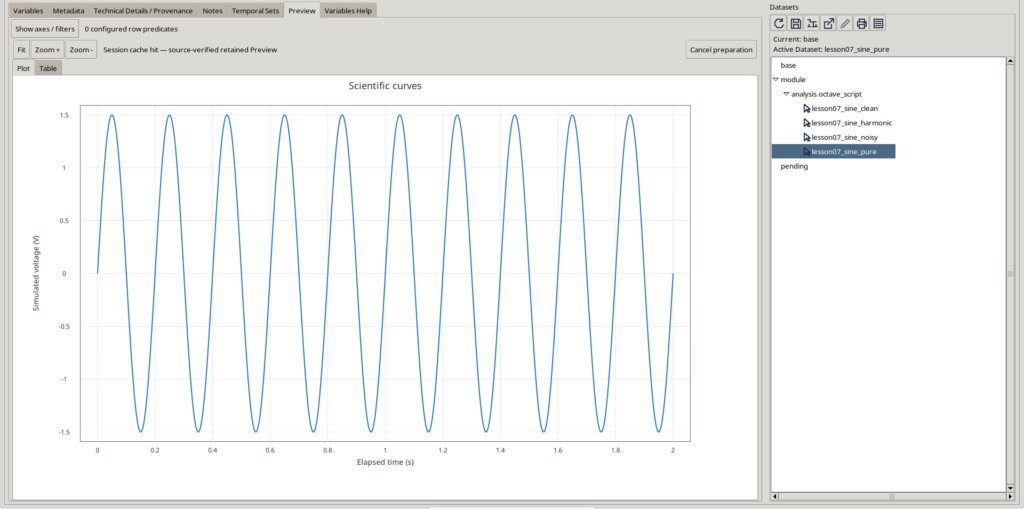
GX-TXT plot of a pure 5 Hz sine wave with 1.5 V amplitude, showing ten cycles over two seconds.

GX-TXT – Pure 5 Hz Sine Wave

ALT: GX-TXT plot of a pure 5 Hz sine wave with 1.5 V amplitude, showing ten cycles over two seconds.

Caption: Pure 5 Hz sine wave used as the reference for comparison with noisy and harmonic signals.

Description:

Preview of Dataset lesson07_sine_pure, generated with GNU Octave and published through GX-TXT public APIs. The curve contains 801 samples over two seconds, with a sampling rate of 400 Hz. The signal provides the mathematical reference for the other two Datasets in the second experiment.

Download image

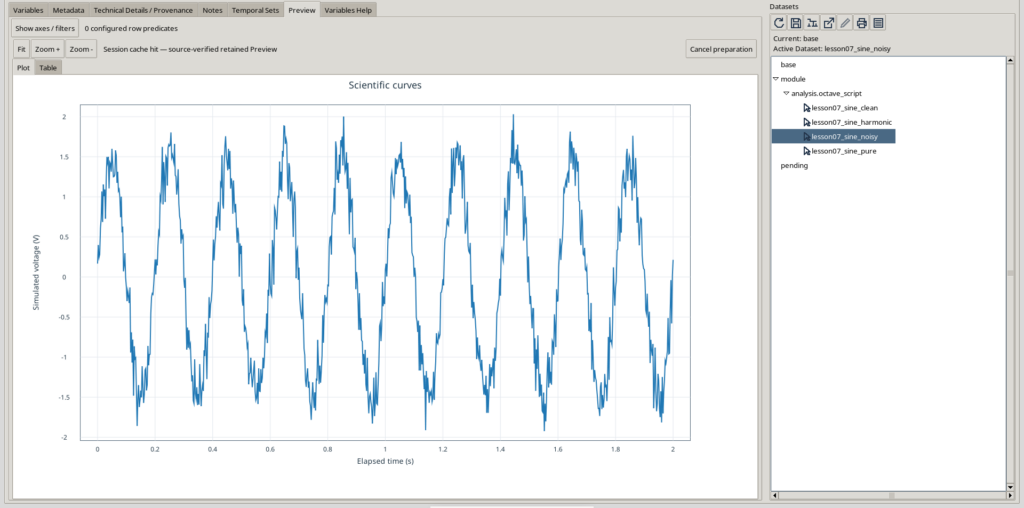
GX-TXT preview of a 5 Hz sine wave affected by synthetic Gaussian noise.

GX-TXT – Sine Wave with Gaussian Noise

ALT: GX-TXT preview of a 5 Hz sine wave affected by synthetic Gaussian noise.

Caption: Synthetic 5 Hz sine wave with Gaussian noise having a nominal standard deviation of 0.20 V.

Description:

Preview of Dataset lesson07_sine_noisy, containing 801 samples generated with GNU Octave over two seconds. The sine wave, with an amplitude of 1.5 V, is affected by pseudorandom Gaussian noise generated using randn(). The graph shows random fluctuations superimposed on the periodic signal.
Download image

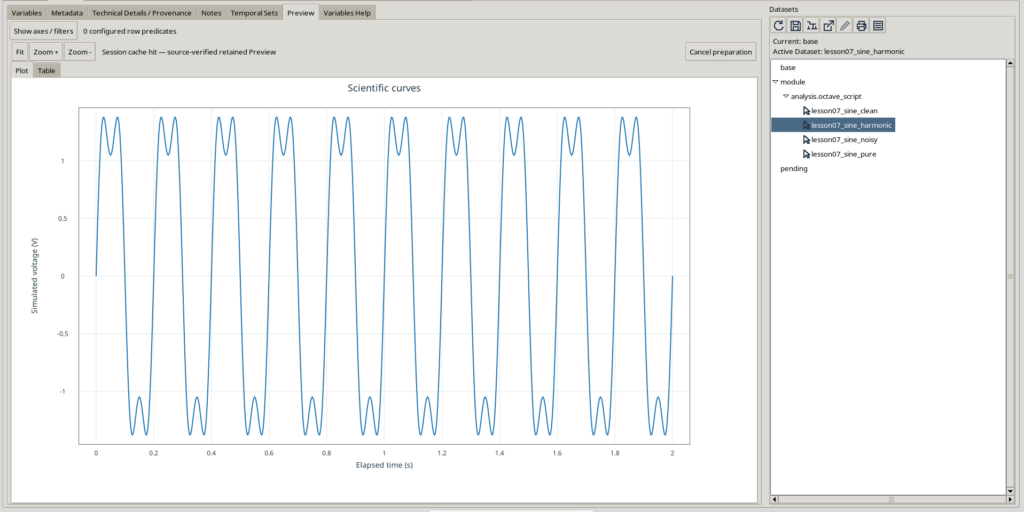
GX-TXT plot of a 5 Hz sine wave with a 15 Hz third harmonic and periodic waveform distortion.

GX-TXT – Sine Wave with Third Harmonic

ALT: GX-TXT plot of a 5 Hz sine wave with a 15 Hz third harmonic and periodic waveform distortion.

Caption: A 5 Hz sine wave with a 15 Hz third harmonic, illustrating deterministic harmonic distortion.

Description:

Preview of Dataset lesson07_sine_harmonic, generated with GNU Octave. The signal combines a 5 Hz fundamental with 1.5 V amplitude and a 15 Hz third harmonic with 0.45 V amplitude. The curve demonstrates waveform distortion caused by harmonic superposition.

Download image