6BX7-GT – SPICE validation on GE page 3 plate characteristics

All gallery images with Media Library metadata and download links.

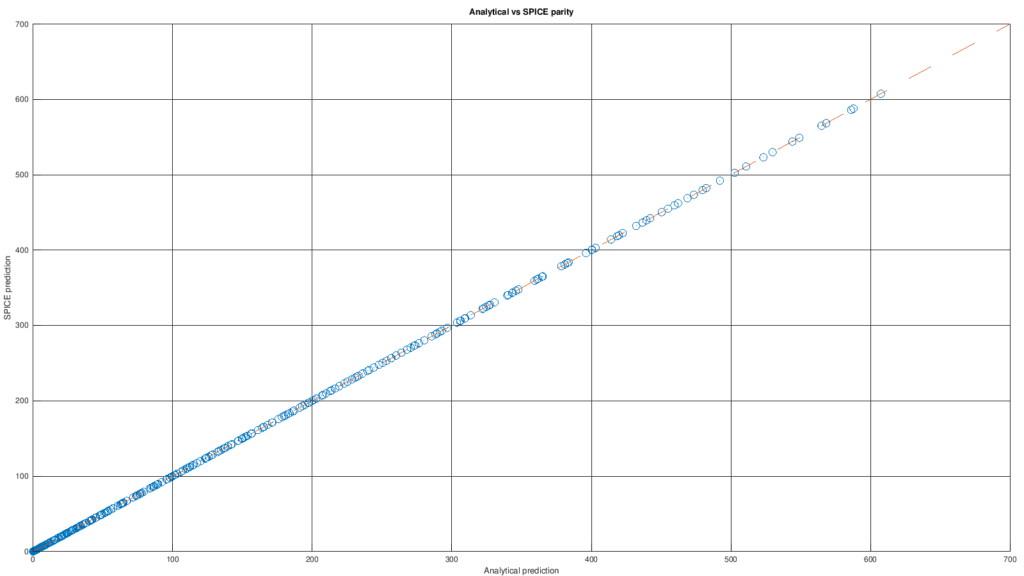
Parity plot between analytical prediction and SPICE model prediction for the 6BX7-GT

6BX7-GT – Parity plot between the analytical model and the SPICE model

ALT: Parity plot between analytical prediction and SPICE model prediction for the 6BX7-GT

Caption: Parity plot of the 6BX7-GT SPICE verification. Each point compares the analytical model prediction with the SPICE subcircuit prediction; the diagonal represents ideal agreement.

Description:

Direct comparison between the plate current predicted by the analytical 6BX7-GT model and the current produced by the SPICE subcircuit derived from the same formulation. The close alignment of the points with the diagonal shows that the SPICE translation faithfully reproduces the analytical law.

Download image

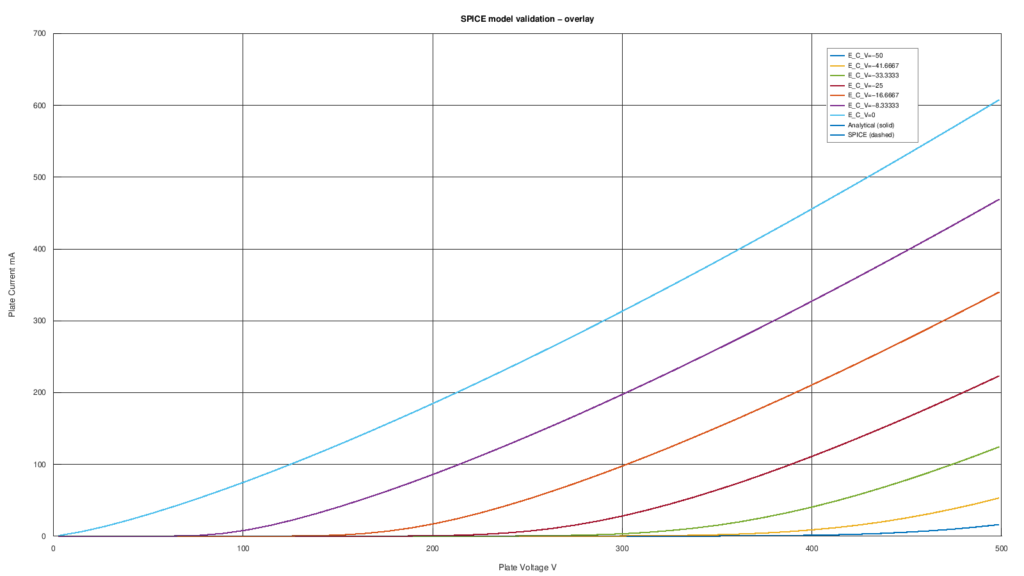
Direct comparison between analytical-model curves and SPICE-model curves for the 6BX7-GT

6BX7-GT – Direct comparison between the analytical model and the SPICE model

ALT: Direct comparison between analytical-model curves and SPICE-model curves for the 6BX7-GT

Caption: Comparison between the analytical model and the 6BX7-GT SPICE subcircuit for a representative set of curves. The two responses are practically superimposed.

Description:

Overlay between the curves generated by the analytical 6BX7-GT model and those produced by the SPICE subcircuit derived from the same formulation. The graph shows that the SPICE conversion introduces no appreciable difference relative to the analytical model.

Download image

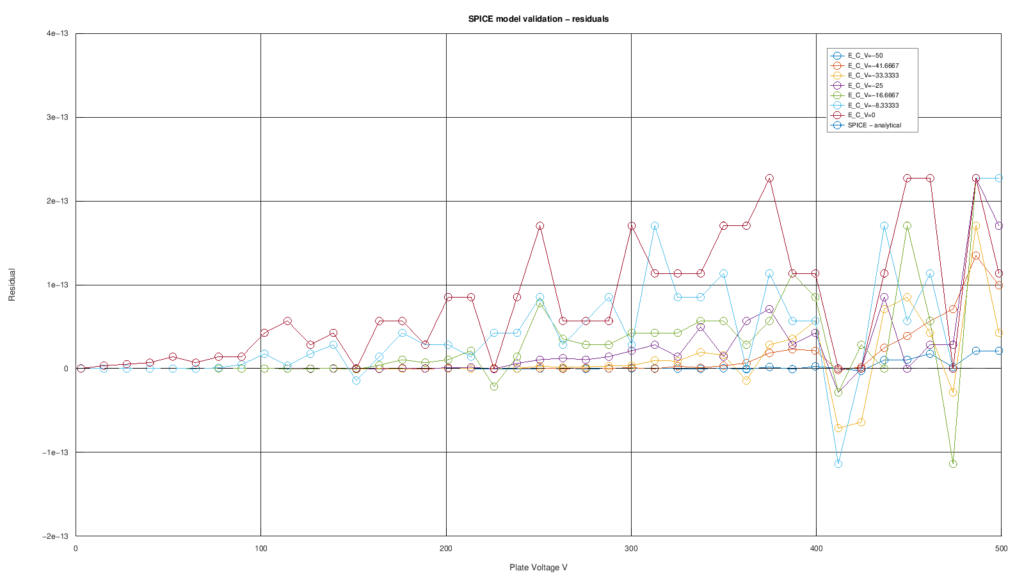
Residuals between the SPICE model and the analytical model of the 6BX7-GT

6BX7-GT – Residuals of the SPICE verification

ALT: Residuals between the SPICE model and the analytical model of the 6BX7-GT

Caption: Residuals of the 6BX7-GT SPICE verification. Differences between the SPICE subcircuit and the analytical model are at the level of numerical precision.

Description:

Residual plot obtained by comparing the 6BX7-GT SPICE subcircuit with the corresponding analytical formulation. The extremely small error scale shows that the SPICE model reproduces the analytical model within numerical precision.

Download image

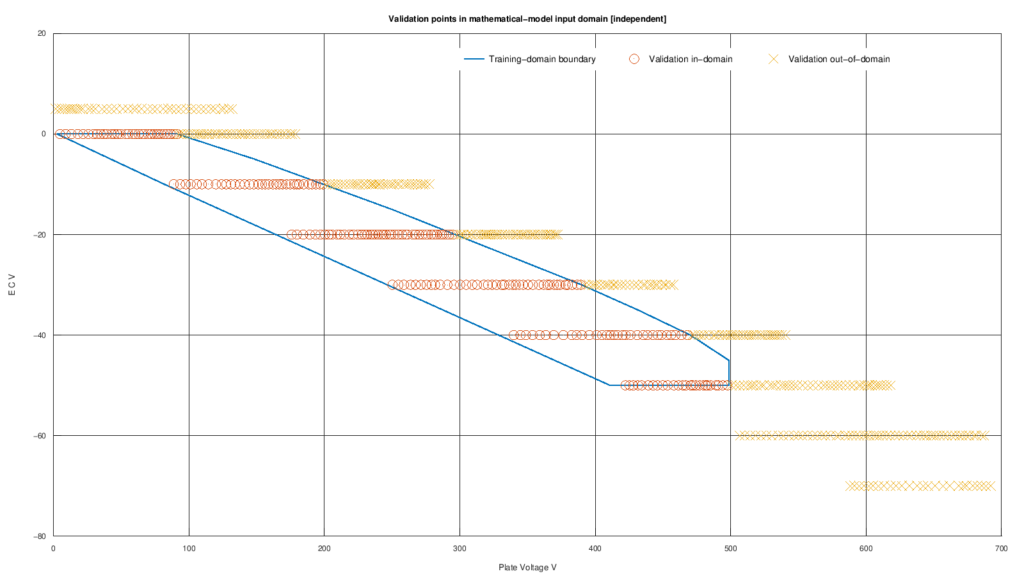
Independent validation points of the 6BX7-GT classified against the fitting domain in the Va-Vg plane

6BX7-GT – Domain map of the independent page 3 validation

ALT: Independent validation points of the 6BX7-GT classified against the fitting domain in the Va-Vg plane

Caption: Map of the independent-validation points in the Va–Vg plane. The blue boundary represents the domain covered by the fitting data; points are classified as in-domain or out-of-domain.

Description:

Classification plot of the points belonging to the first independent validation dataset, derived from the upper graph on page 3 of the GE datasheet. The figure clearly distinguishes interpolation conditions from extrapolation conditions for the model.

Download image

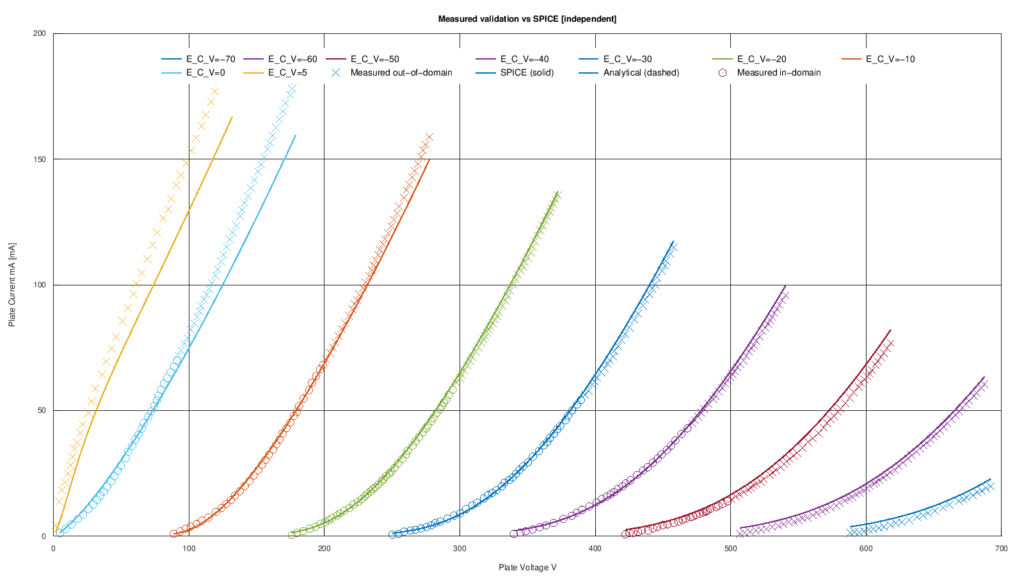
Comparison between digitized General Electric datasheet data and the SPICE model in the independent validation of the 6BX7-GT

6BX7-GT – Independent validation of the SPICE model on GE page 3 curves

ALT: Comparison between digitized General Electric datasheet data and the SPICE model in the independent validation of the 6BX7-GT

Caption: Independent validation of the 6BX7-GT on the page 3 dataset. Data digitized from the GE datasheet are compared with the SPICE model and the corresponding analytical model; points are distinguished as in-domain or out-of-domain.

Description:

Comparison between independent data digitized from the upper graph on page 3 of the General Electric datasheet and the response of the 6BX7-GT SPICE model, with parameters frozen from the previous fit. The graph also shows the agreement between the SPICE implementation and the analytical model during validation.
Download image

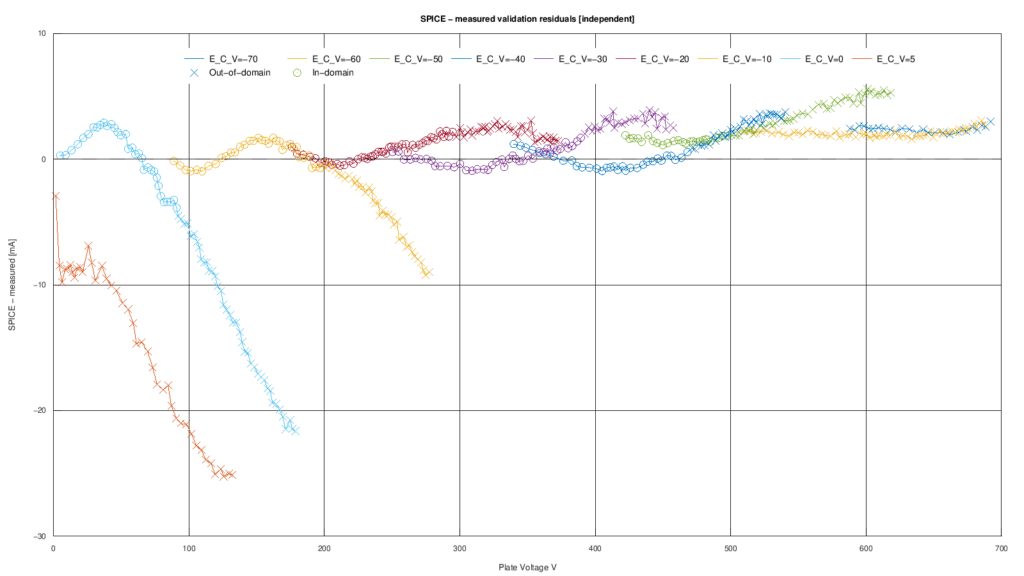
Residuals between the SPICE model and digitized GE datasheet data in the independent validation of the 6BX7-GT

6BX7-GT – Residuals of the independent SPICE validation

ALT: Residuals between the SPICE model and digitized GE datasheet data in the independent validation of the 6BX7-GT

Caption: Residuals of the independent validation of the 6BX7-GT. The graph shows the difference between the SPICE model and the data digitized from the GE datasheet, distinguishing points inside and outside the fitting domain.

Description:

Residual plot obtained by comparing the 6BX7-GT SPICE model with the first independent validation dataset derived from the General Electric datasheet. It is useful for observing how the error is distributed along the different curve families and for highlighting regions where extrapolation worsens the agreement.

Download image