6BX7-GT – Independent validation on GE page 3 transfer characteristics

All gallery images with Media Library metadata and download links.

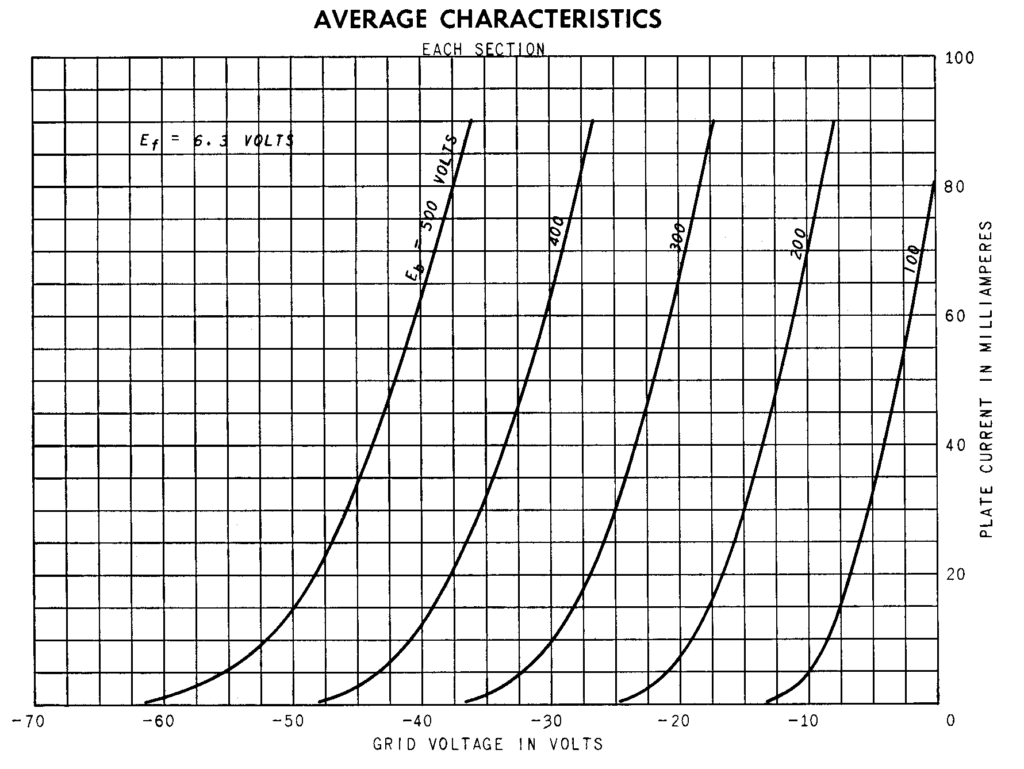
Original General Electric 6BX7-GT graph showing plate current versus grid voltage at constant plate voltage

6BX7-GT – Original graph digitized for the second independent validation

ALT: Original General Electric 6BX7-GT graph showing plate current versus grid voltage at constant plate voltage

Caption: Lower graph on page 3 of the General Electric 6BX7-GT datasheet, used as the source for the second independent validation dataset.

Description:

Original 6BX7-GT characteristic graph from the General Electric datasheet. Plate current is plotted versus grid voltage at constant plate voltages of 100, 200, 300, 400 and 500 V. The curves were digitized to create the second independent validation dataset.
Download image

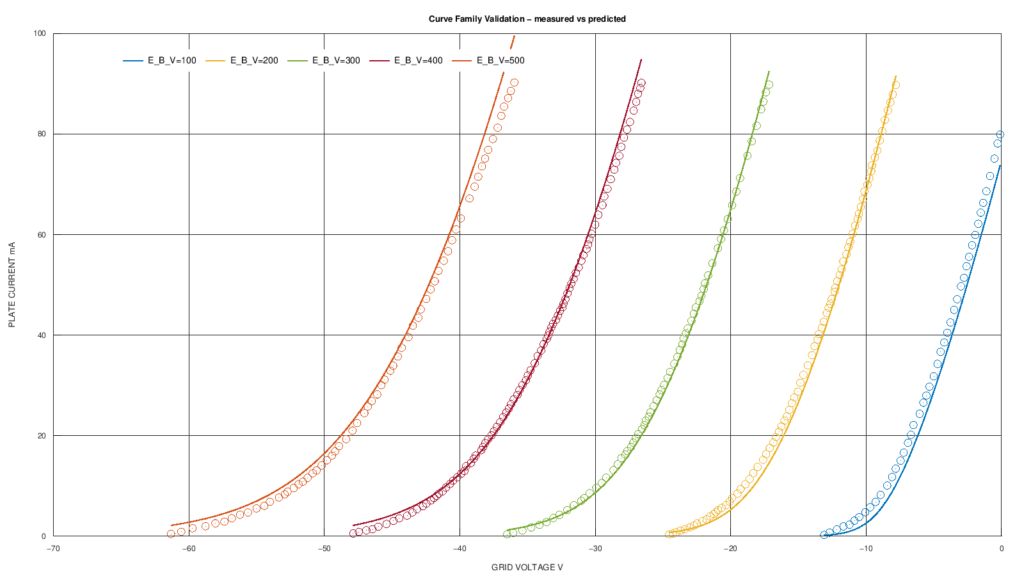
6BX7-GT comparison between digitized General Electric datasheet data and model predictions in the second independent validation

6BX7-GT – Second independent validation on GE page 3 curves

ALT: 6BX7-GT comparison between digitized General Electric datasheet data and model predictions in the second independent validation

Caption: Second independent validation of the 6BX7-GT. Circles represent data digitized from the lower graph on page 3 of the GE datasheet; lines show model predictions at plate voltages of 100, 200, 300, 400 and 500 V.

Description:

Comparison between data digitized from the lower graph on page 3 of the General Electric 6BX7-GT datasheet and predictions from the mathematical model with frozen parameters. The curves show plate current versus grid voltage at constant plate voltage.

Download image

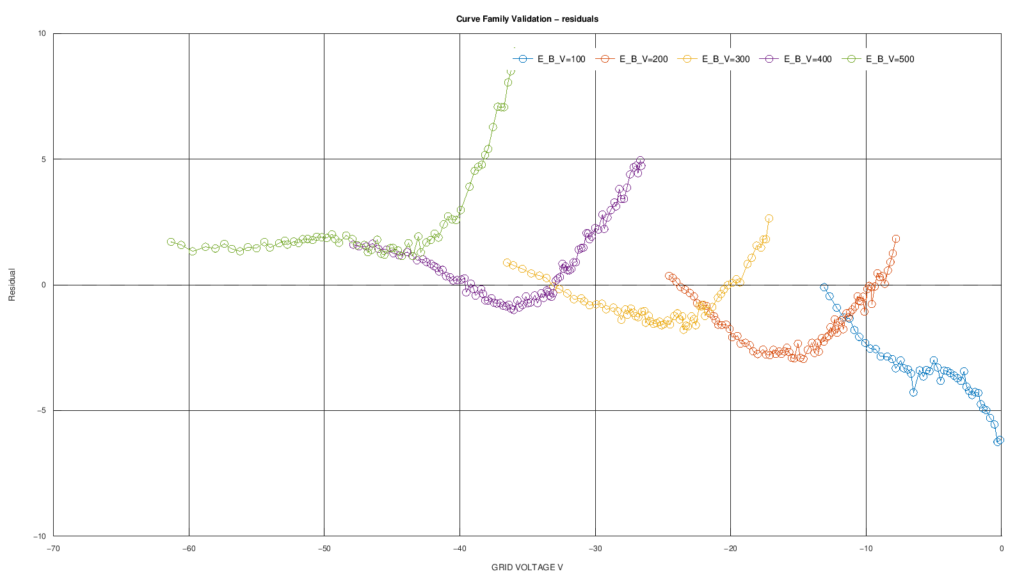
Residuals in milliamperes for the second independent validation of the 6BX7-GT model at plate voltages from 100 to 500 V

6BX7-GT – Residuals of the second independent validation

ALT: Residuals in milliamperes for the second independent validation of the 6BX7-GT model at plate voltages from 100 to 500 V

Caption: Residuals of the second independent validation of the 6BX7-GT, expressed in mA, for plate voltages of 100, 200, 300, 400 and 500 V.

Description:

Difference between plate current predicted by the model and data digitized from the GE datasheet in the second independent validation. The graph shows how the error varies with grid voltage for each of the five plate-voltage conditions.

Download image

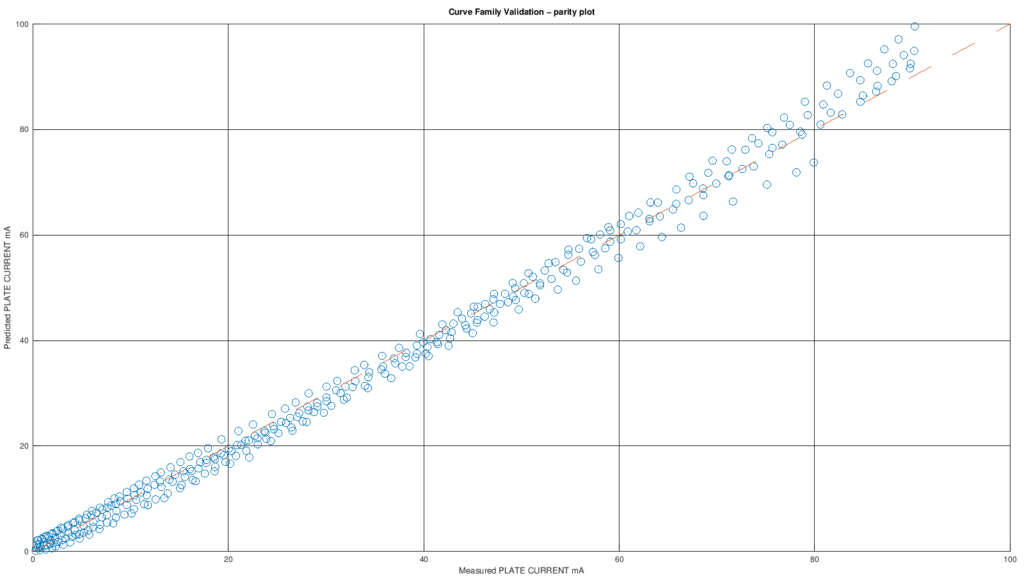
Parity plot comparing digitized GE datasheet plate current with model predictions in the second independent validation of the 6BX7-GT

6BX7-GT – Parity plot of the second independent validation

ALT: Parity plot comparing digitized GE datasheet plate current with model predictions in the second independent validation of the 6BX7-GT

Caption: Parity plot of the second independent validation of the 6BX7-GT. Each point compares plate current digitized from the GE datasheet with the model prediction; the diagonal indicates ideal agreement.

Description:

Direct comparison between plate-current values from the second independent page 3 dataset and those predicted by the mathematical model. Dispersion from the diagonal provides a visual assessment of predictive accuracy across the full dataset.

Download image

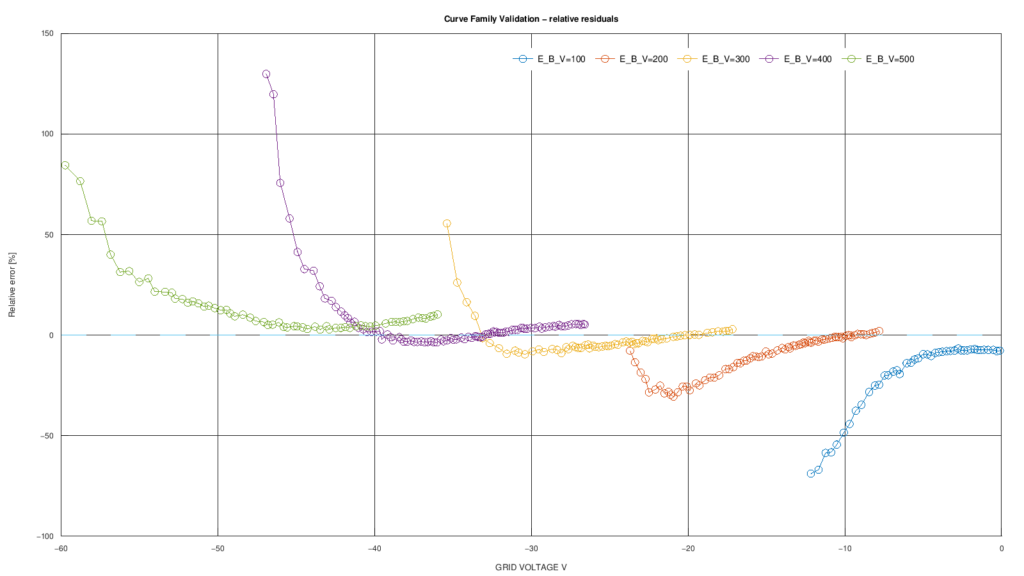
Relative percentage error of the 6BX7-GT model in the second independent validation at plate voltages from 100 to 500 V

6BX7-GT – Relative residuals of the second independent validation

ALT: Relative percentage error of the 6BX7-GT model in the second independent validation at plate voltages from 100 to 500 V

Caption: Relative residuals of the second independent validation of the 6BX7-GT. Percentage errors become more sensitive in regions where plate current approaches zero.

Description:

Relative percentage error between model predictions and data digitized from the GE datasheet in the second independent validation. The graph allows comparison of relative model error across the five plate-voltage conditions.

Download image

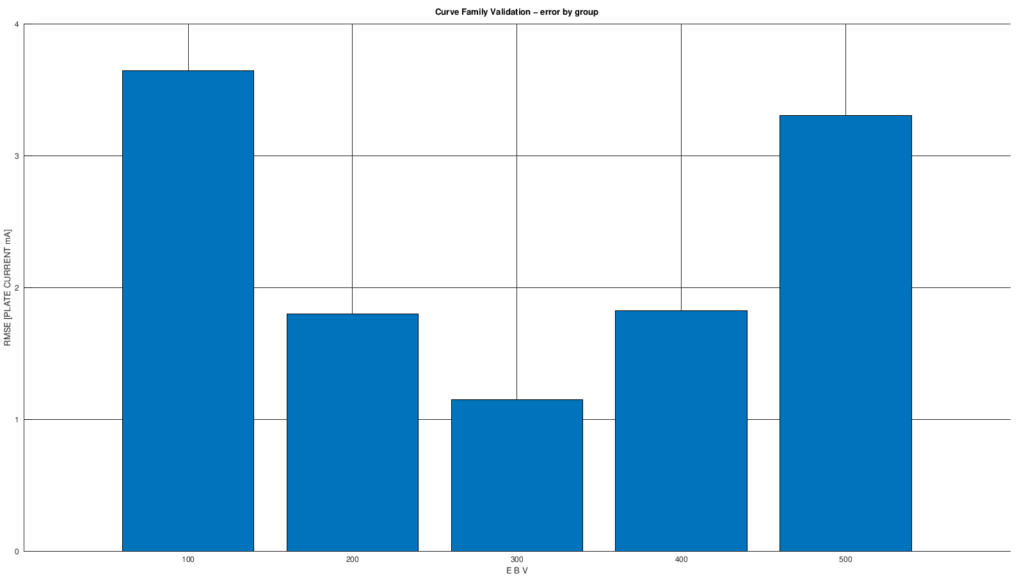
RMSE of the second independent validation of the 6BX7-GT model grouped by plate voltage from 100 to 500 V

6BX7-GT – Second-validation RMSE by plate voltage

ALT: RMSE of the second independent validation of the 6BX7-GT model grouped by plate voltage from 100 to 500 V

Caption: RMSE of the second independent validation calculated separately for plate voltages of 100, 200, 300, 400 and 500 V.

Description:

Distribution of the model root-mean-square error across the five curve families of the second independent page 3 dataset. The graph shows how model accuracy varies with plate voltage.

Download image