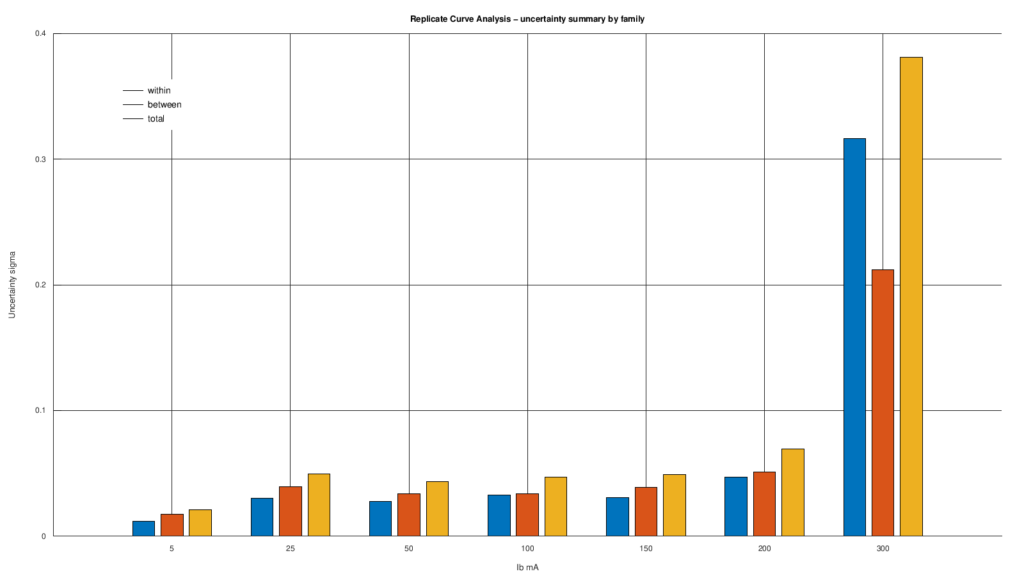
Description: Comparison of the RMS values of (sigma_{mathrm{within}}), (sigma_{mathrm{between}}), and (sigma_{mathrm{total}}) for (I_a=5,25,50,100,150,200,300 mathrm{mA}). The plot clearly highlights the different quality of the 300 mA family, which has a shorter available domain and much greater dispersion than the other curves.