

Open Replicate Curves
Replicate Curves builds a consensus profile from observations of the same physical feature. Each source retains its links to the Dataset, variables and original rows. The study design determines what you can infer from the spread between traces.
Open a study
Open the Session that contains the Dataset. On the Viewers tab, under Curves & Digitization, click Replicate Curves. Type Replicate Curves in the Search field to filter the panes. Empty the field to see them all again. The window is named Replicate / Consensus Curves. The viewer opens with a new draft by default. To reopen a saved study use Workspace → Open workspace…. Opening the viewer does not start a Job.
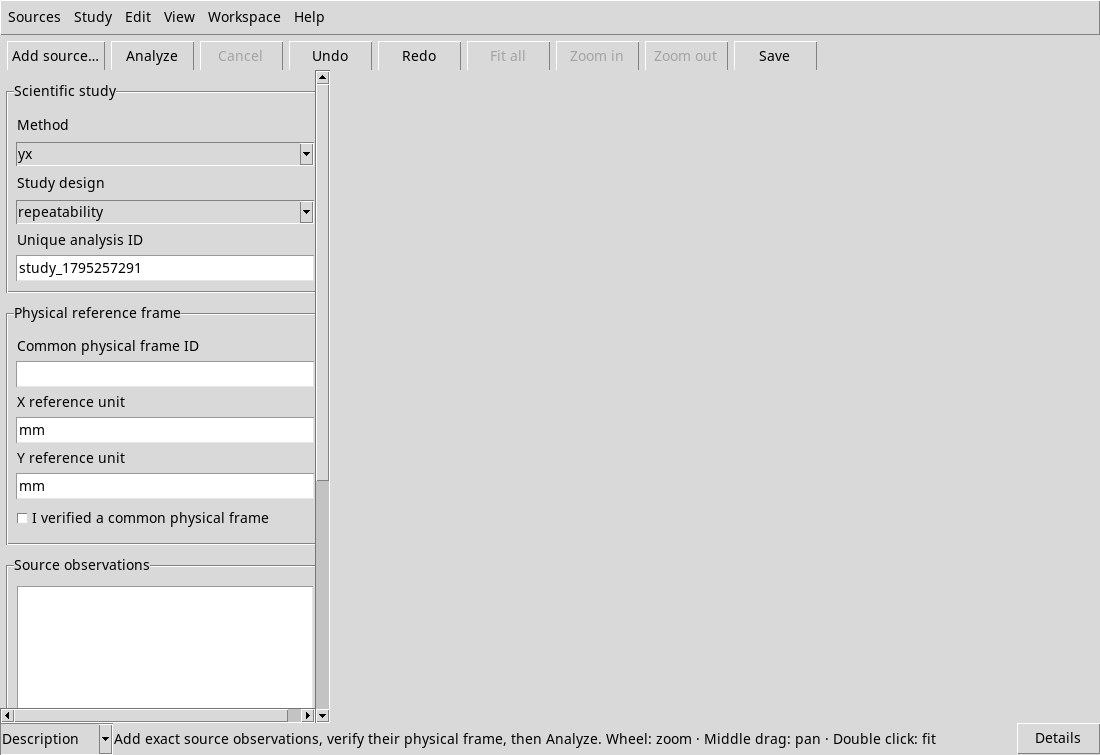
Toolbar and menus
| Location | Actions |
|---|---|
| Sources | Add source… opens the form for a canonical source with Ctrl + O. Add Digitizer source… opens the path dedicated to Digitalizer publications. Edit selected source… and Remove selected source act on the selected line in the source list. |
| Study | Analyze launches validation and Job, even with F5. Cancel requires the cancellation of a Job in progress. Publish results writes the Dataset and Publish Graph creates the editable graphic variant. |
| Edit | Undo and Redo navigate the recorded steps. The shortcuts displayed are Ctrl + Z and Ctrl + Y. |
| View | Fit all, Zoom in and Zoom out regulate the result view when available. |
| Workspace | Save saves the context, even with Ctrl + S. The other commands manage creation, opening, transfer and closing. See Workspace. |
| Help | Opens manual and version information. See Built-in help. |
The bar repeats Add source…, Analyze, Cancel, Undo, Redo, Fit all, Zoom in, Zoom out and Save. The actions that depend on selection, Job or chart are enabled when the state allows it. To repeat an action of the bar you can use the corresponding menu.
Inspector, plot area and bottom strip
Use the inspector’s vertical scrollbar to reach the list of observations, results qualifications, and Retained curve visibility. If the controls are wider than the panel, use the horizontal scrollbar. Drag the divider between inspector and chart to redistribute the space.
The bottom strip offers Description to read messages, Job outcome and selection details. History instead shows the study steps. Details opens a scrollable window to read the entire status or history. In case of refusal, switch to Description and open Details to read the reason.
Context menu
Right-click the source list or the chart area. Edit selected source… and Remove selected source act on the source already selected. Fit all and the two Zoom commands require the chart. Analyze, Publish results, Publish Graph and Save are the same menu commands. To change the source you see near the pointer, select it first in the list or with a click on an original point.
Built-in help
Help → User Manual… or F1 opens the integrated manual. About Module… shows the name, installed version and module identifiers. Close your information with OK.
In the manual, Manual shows the text. Interactive Tutorial shows the selector of the recorded lessons. If No interactive tutorial package is installed for this module. appears, return to Manual. Use Find and Find next to search for a word. View → Find… and Ctrl + F lead to the field. Back and Forward run the pages visited, User Manual returns to the home page and Close returns to the study. The zoom of the View menu is available for contents that display a zoom and appears disabled on the text page. The References menu opens the technical documents declared by the module. Technical manual (Markdown) shows the technical manual. CURVE_REPLICATE_ANALYSIS_API_v1 describes studies and products, VIEWER_GUI_HOST_API_v1 host controls, PLOT_DATASET_API_v4 graphics, SESSION_WORKSPACE_API_v1 Workspace and REPLICATE_VIEWER_API_v1 integration, including Digitizer sources.