

Analysis and plot
Press Analyze after choosing method, design and frame and checking the source list. The service validates the request, then sends a scientific Job. You can follow the outcome from the bottom bar.
Analyze, F5 and Cancel
Analyze is available on the toolbar, in Study and in the context menu. Press F5 while the viewer has focus. A valid request produces a status such as Replicate scientific Job: QUEUED or RUNNING. QUEUED means that the supervisor has yet to start the work. Wait for COMPLETED and check the study confirmation for the number of consensus points.
Use Cancel during the Job and wait for the CANCELLED status. The command is disabled at rest. Changes to sources and switching to another Workspace are limited during execution. If a Job finishes in FAILED, open Jobs in GX-TXT, and double-click the execution line to see the details. Use the cause reported to decide whether to correct data or statements before retrying.
Recover the journal after an interruption
- Open Jobs in the Session Bar. In the Script Jobs window, use Jobs → Reconnect / recover local journal to reconnect to the supervisor and read the local journal.
- Recognize the execution from the name Replicate study <analysis ID>, from the time and ID of the Job. A break may appear as INTERRUPTED with the Supervisor restarted; interrupted work was not replayed cause. The journal records the outcome of the original ticket. The interrupted calculation is not re-executed and the viewer does not adopt a result from that ticket.
- Return to the viewer and wait for Analyze to become available. Verify the Session, sources and study settings. Press Analyze to create a new ticket. Check that it completes and verify the number of consensus points reported by the viewer.

The viewer adopts the result if the Session, sources and request match those of the Job. A completed Job may have no adopted result if a source changed or a receipt exceeds 512 KiB and the Workspace is unsaved. In the latter case, keep the study without the result, save it, and explicitly run Analyze again. If the receipt exceeds the verification limit, narrow the study in a scientifically justified way. If source verification rejects a newly admitted request and the ticket status cannot be read, the status bar may show Job state is unconfirmed. Use Cancel to retry the request while the command is still available.
Consensus and stored curves
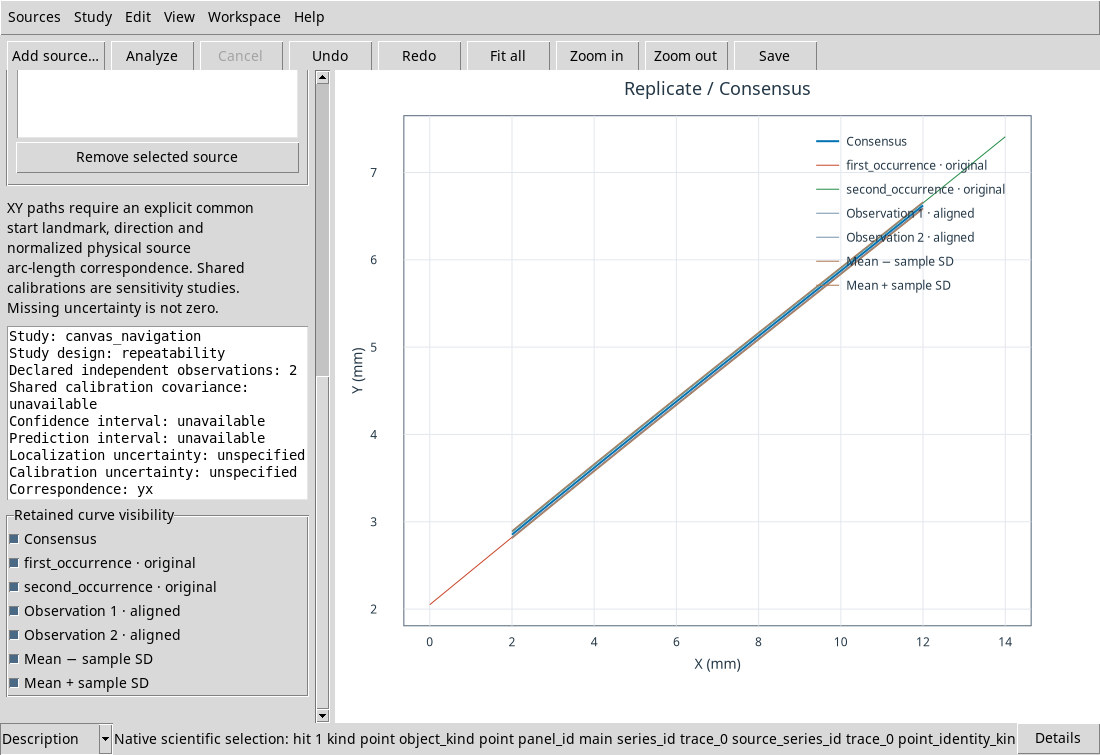
In the Replicate / Consensus chart, the Consensus curve connects the X/Y averages to the aligned positions. Axes names include units. The original tracks and consent are visible initially. Scroll to Retained curve visibility to show or hide each series. This operation records a change of visibility in History and acts on the data already available.
- Consensus
- Show or hide the average profile. Compare it with the tracks before interpreting the dispersion.
- <observation ID> · original
- Shows the observation’s canonical points in source order, converted to the study units. In yx the trace may extend beyond the common domain.
- Observation N · aligned
- Shows interpolated samples of the N-th track on the common grid. The lined series starts hidden. Enable them to examine correspondence, especially with xy_path.
- Mean − sample SD and Mean + sample SD
- The two series show the descriptive Y limits separately when SD is available across the entire grid. Both checkboxes start unchecked. See the explanation of sample SD before interpreting them.
Fit all, zoom and pan
Fit all restores the view on the limits of the graph. You can call it from the bar, from View, from the context menu or double-click in the chart. Zoom in tightens the view around the center, Zoom out widens it. Use the wheel in the zoom chart near the pointer. Drag with the central button to move the view. These actions change the display and retain the calculated scientific profile.
Select an original point
Click close to an original track point. The bar can show Native scientific selection with the identity of the point and series. When you recognize an original track, the viewer highlights the corresponding observation in the list. Use Details in Description mode to read the text if it exceeds the window width. The aligned samples or consent are derived. To trace back to a scientific order, choose an original track.
Interpret result qualifications
Scroll the inspector to the read-only box. Study identifies the displayed result. Study design and Declared independent observations show the study design and number of distinct observations. Correspondence identifies the matching model, such as yx, open or closed. Check Shared calibration covariance, Confidence interval, Prediction interval, Localization uncertainty and Calibration uncertainty before interpreting a band. Unavailable means the quantity is unavailable, while unspecified means it was not specified. The result records these qualifications in its metadata. After Undo or a change to the sources, the tested version may still show the old values or message. Before interpreting them, verify that the new plot is present and that the result has the expected ID. Run Analyze again if necessary.