

How Many People per Hundred Places?
Using the same unit makes it possible to compare countries. Within Italy, a national figure hides considerable gaps between regions.
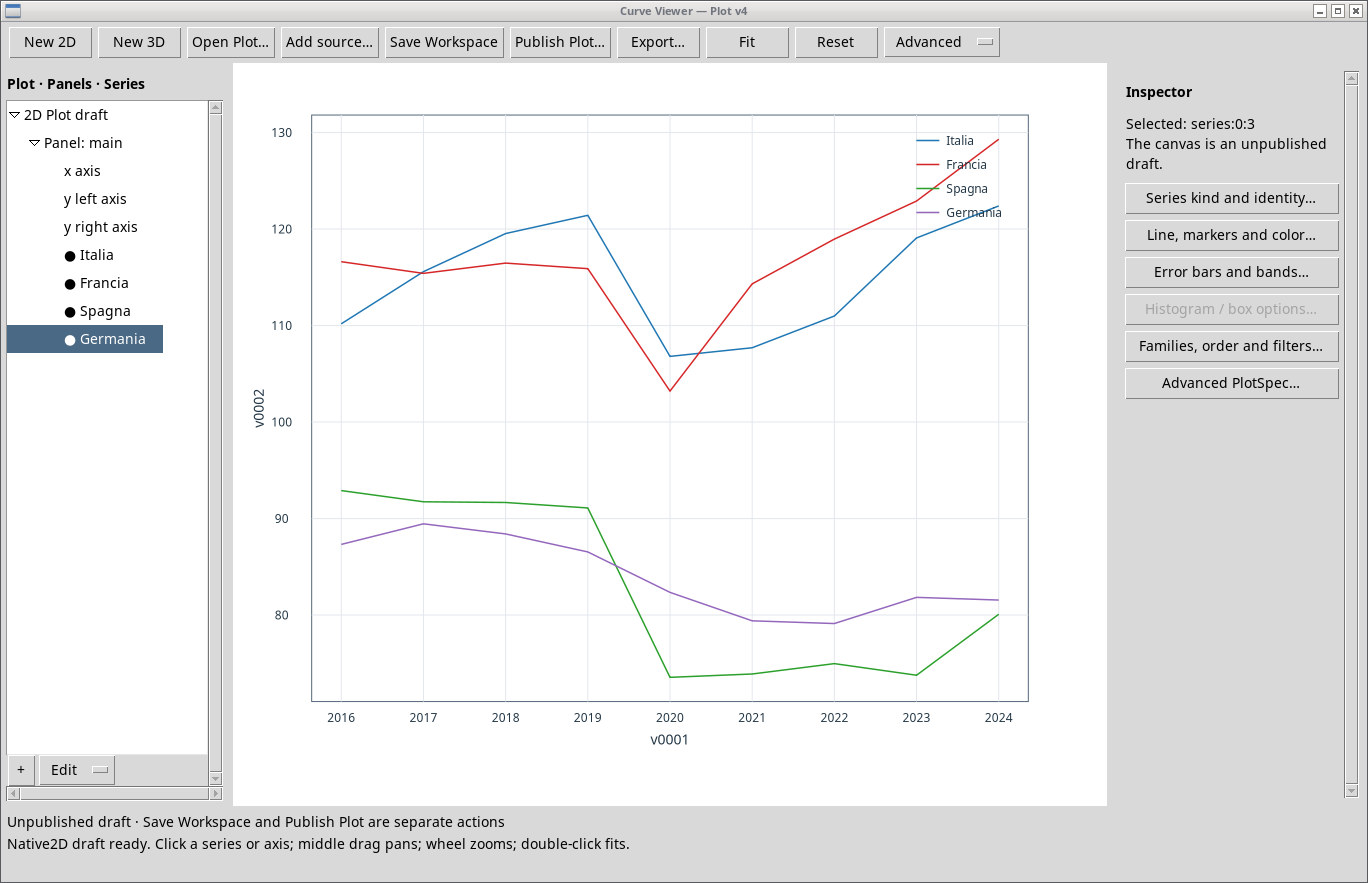
Four European countries
| Country | Ratio |
|---|---|
| Italy | 122.4 |
| France | 129.3 |
| Spain | 80.1 |
| Germany | 81.6 |
France and Italy are above 100, while Spain and Germany are below. These are four countries chosen for comparison. The reference date and the institutions included can differ between national systems. For Germany, Eurostat documents reference dates other than 31 December. Eurostat definitions and dates.
Figure 1
Regional differences in the DAP snapshot
As of 31 December 2025 the Department of Penitentiary Administration (DAP) reports 63,499 people held and 51,277 places. The ratio is about 123.8 per 100 nationally, 143.4 in Lombardy, 126.8 in Campania and 98.2 in Sardinia. The capacity criterion and any temporary unavailability of places are described in the notes to the official table. Ministry of Justice, survey as of 31 December 2025.
This national snapshot comes from a separate source. For 2024 the DAP reports 61,861 people and 51,312 places, while Eurostat reports 63,524 and 51,901. These gaps call for a check of the survey scope. In the European plot we keep a single source for the whole series. Ministry of Justice, 2024 table · Eurostat series.
Data to reproduce the analysis
Prison Population · Data and Methods · Back to the five-studies project