

Why Output and Employment Diverge
In 2024 Italian manufacturing output in volume is below its 2019 level, while employment and hours worked are above it. The size of the gaps becomes visible when all series are rebased to the same year.
Four indicators, one base
| Year | Output | Value added in volume | Hours | Employment |
|---|---|---|---|---|
| 2000 | 122.4 | 102.1 | 124.5 | 115.6 |
| 2009 | 95.2 | 85.4 | 107.2 | 109.4 |
| 2019 | 100.0 | 100.0 | 100.0 | 100.0 |
| 2020 | 88.2 | 86.2 | 87.5 | 97.9 |
| 2024 | 94.8 | 102.3 | 104.1 | 101.8 |
Output is the industrial production volume index for manufacturing, section C of NACE Rev. 2. Value added is measured in chain-linked volumes in the national accounts and covers the value generated net of intermediate consumption. Employment is measured in persons on the domestic concept, consistent with the hours of the same industry. All the 2019-based transformations preserve the relative change of each series. Production index · Value added · Employment and hours.
Figure 1
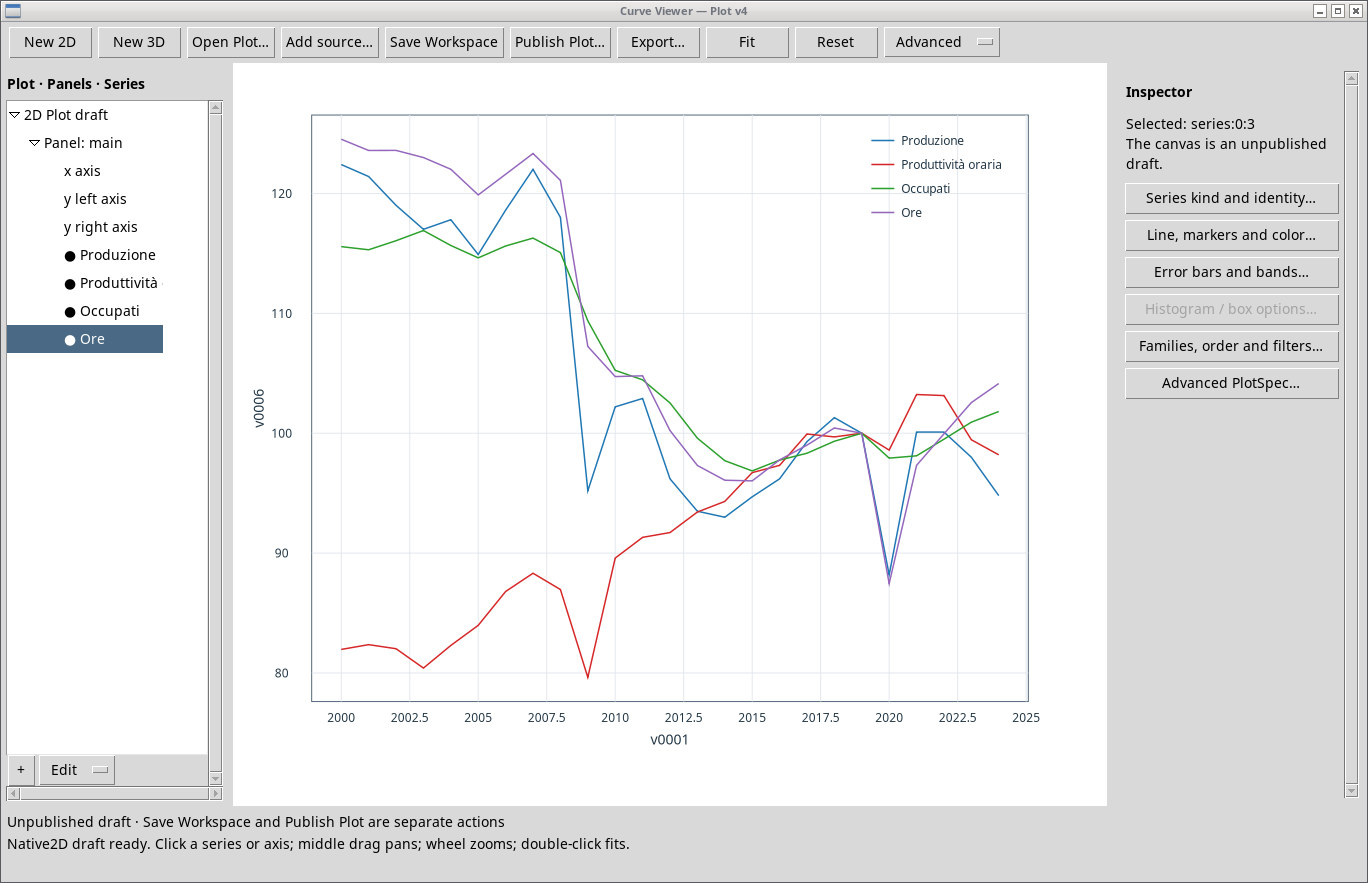
The 2020 shock
Between 2019 and 2020 hours worked fall by 12.5% and employment by 2.1%. On average we go from about 1,778 to 1,588 hours per person employed. This gap shows that the reduction in labor input showed up far more in hours than in the number of people. Attributing the change to short-time work schemes (cassa integrazione), workforce composition or shorter working hours would require separate series.
Which industry we observe
Section C covers manufacturing. Extending the question to mining, energy or construction requires redefining the scope for all variables, because a divergence can also depend on a different industry mix.
Data to reproduce the analysis
Industry and Labor · Data and Methods · Back to the five-studies project