

Value Added per Hour Worked
Real value added per hour worked in manufacturing rose during the 2010s. In 2024 it stands at about 98.2 relative to the 2019 = 100 base.
Measuring output per hour
We divided the value added volume index by the hours worked index and set the ratio to 100 in 2019. In 2024 value added is about 2.3% higher than in 2019, against hours about 4.1% higher. The ratio of these two changes gives hourly productivity about 1.8% lower. Employment and hours are measures of labor input in different units. National accounts by industry · Employment by industry.
The benchmark of the decade before 2020
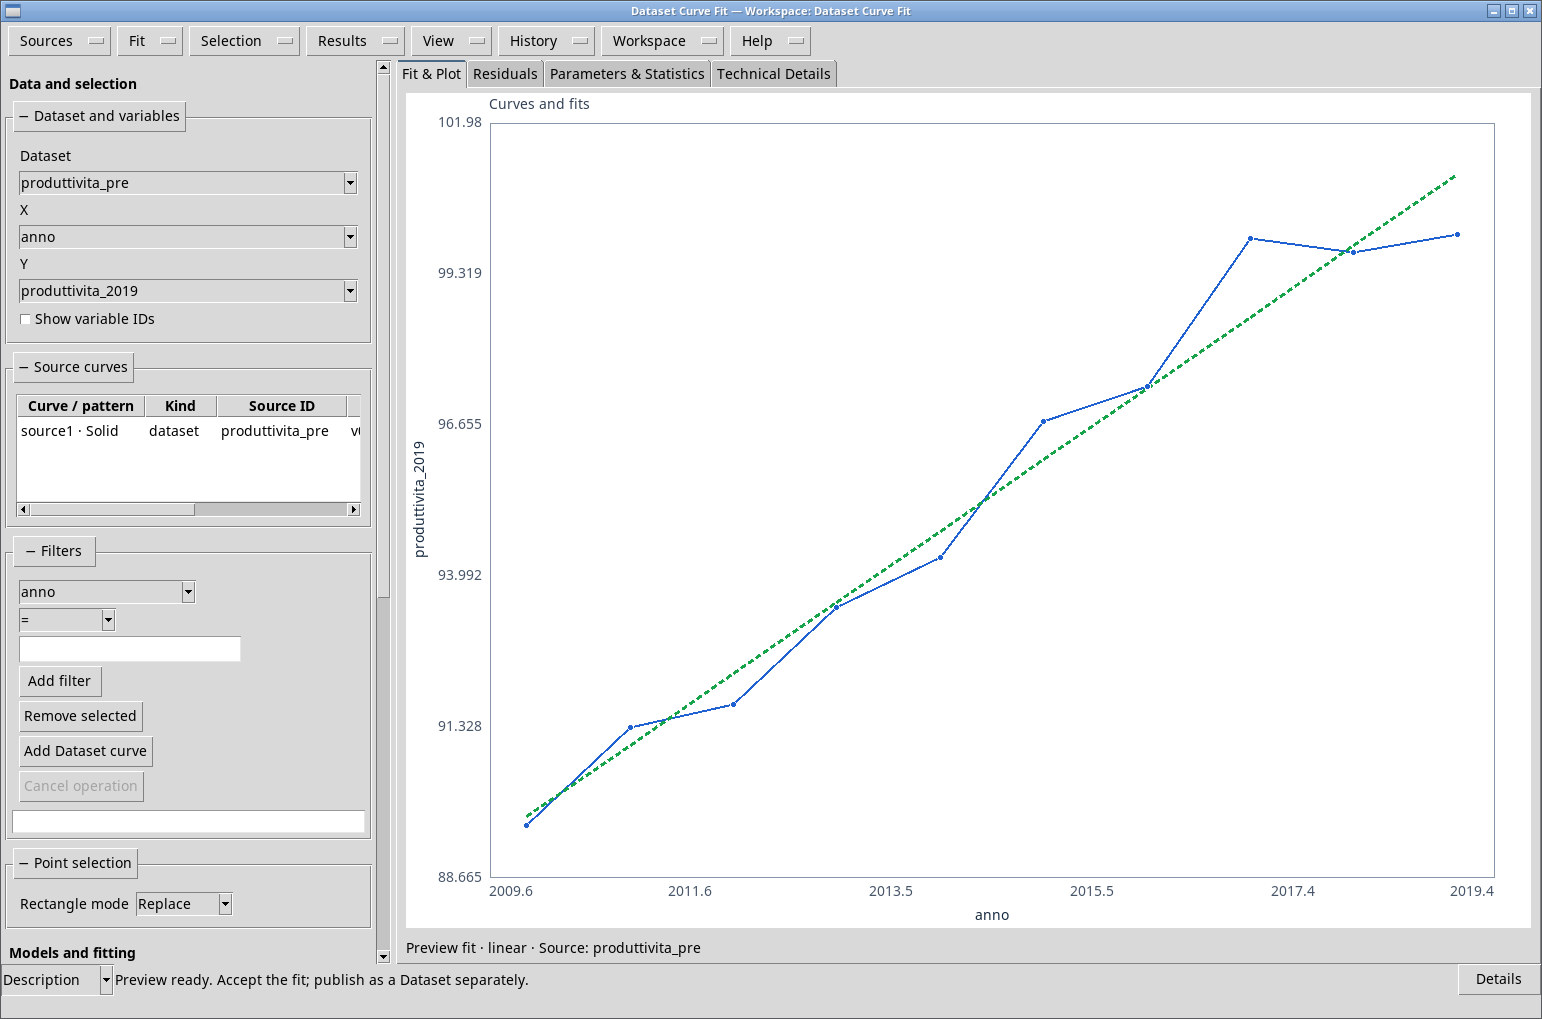
The linear fit over the ten years 2010–2019 gives +1.26 index points per year, R² 0.969 and RMSE 0.65 points. The fit describes that decade. In the following period, by contrast, there is a drop to 98.6 in 2020, a rise to 103.2 in 2021 and a return below 100 from 2023, down to 98.2 in 2024.
Figure 1
Reading the ratio without overinterpreting it
Hourly productivity in an industry can change if the mix of firms shifts, if capacity utilization varies or if investment and technology change. This analysis concerns the aggregate. A closer look at the productivity of individual firms or the contribution of capital requires different data and models.
Data to reproduce the analysis
Industry and Labor · Data and Methods · Back to the five-studies project