

PM10: The Measurement Changes from One Station to Another
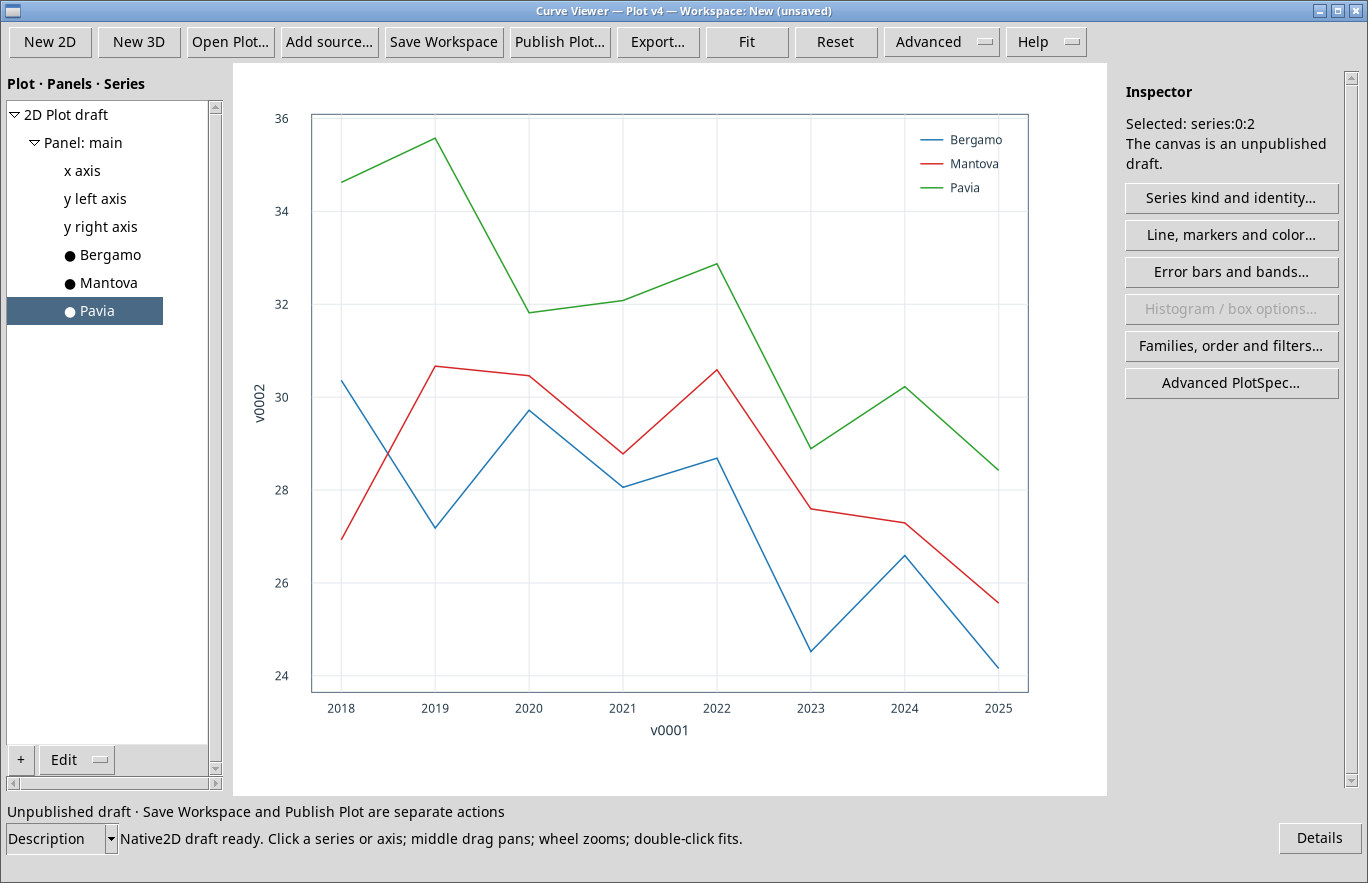
Between 2018 and 2025 mean PM10 decreases in Bergamo, Mantua and Pavia. The size of the decline and its path vary between the monitoring stations.
Three measurements, three sites
| Station | 2018 | 2025 | Difference 2025–2018 |
|---|---|---|---|
| Bergamo v. Garibaldi | 30.36 | 24.16 | −6.21 |
| Mantova S. Agnese | 26.93 | 25.57 | −1.36 |
| Pavia p.zza Minerva | 34.62 | 28.42 | −6.20 |
The series use the daily measurements of the individual stations. We kept values validated with code VA and non-negative concentrations. Every published year reaches at least 90% valid days at each station. The minimum is 90.68% in Bergamo in 2022. Coverage remains a factor in the comparison, especially if gaps are concentrated in one season. ARPA Lombardia, measurements since 2018.
Figure 1
Why two years alone say little
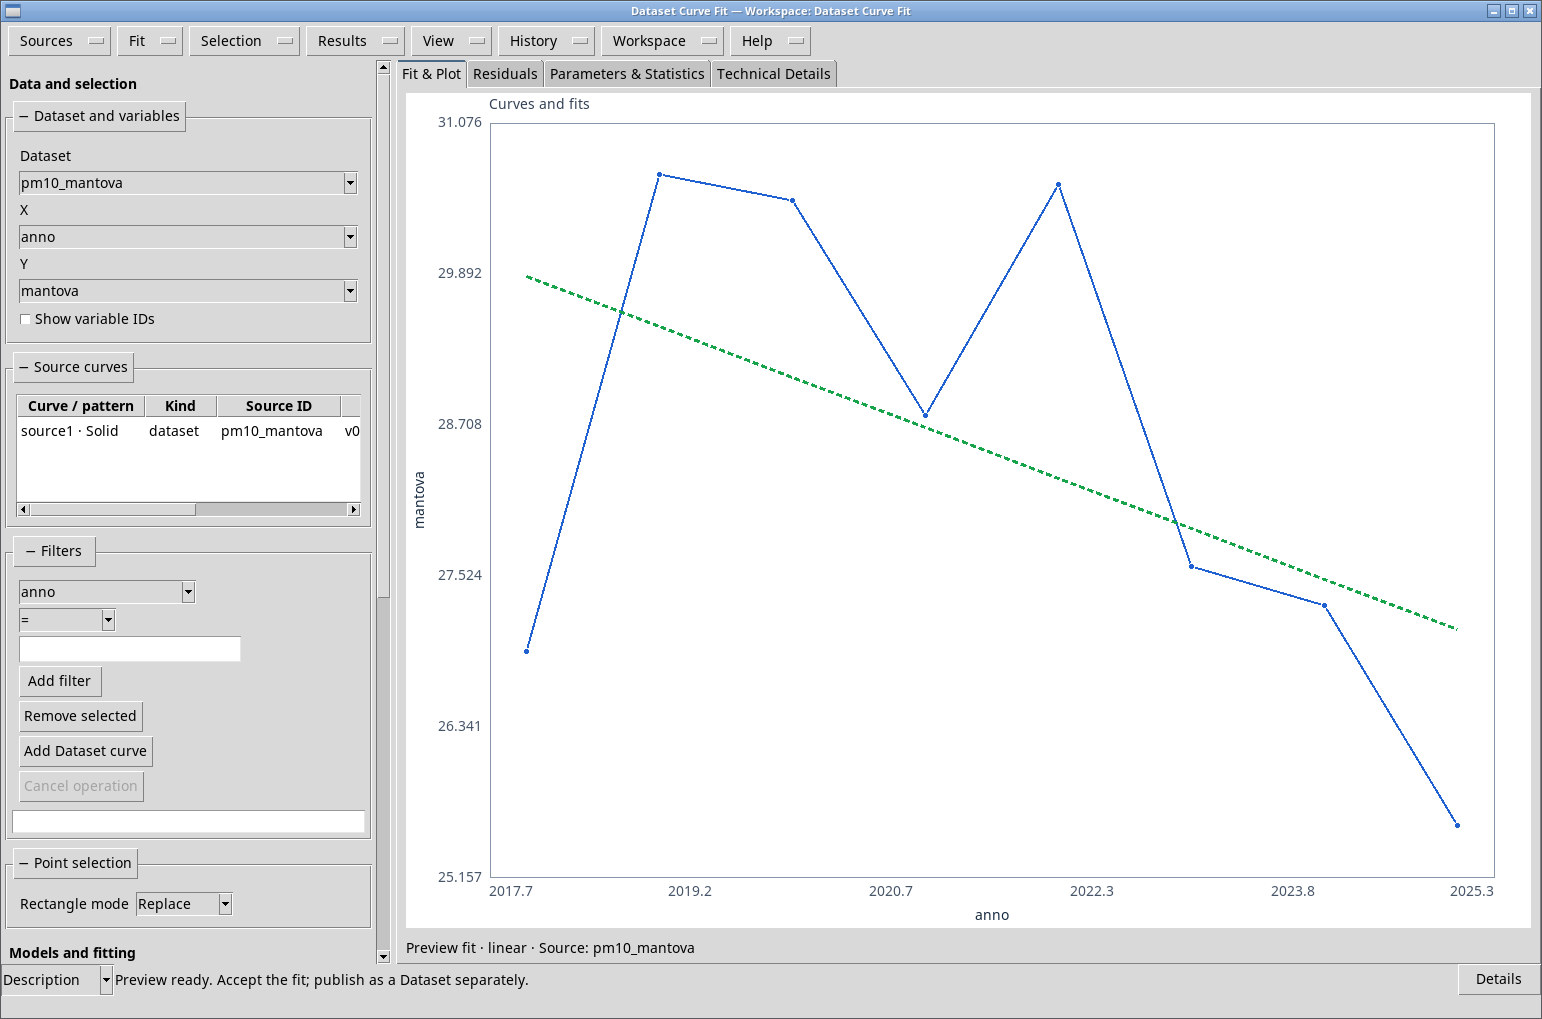
In Mantua, the line through the 2018–2025 annual data has a slope of −0.40 µg/m³ per year, RMSE 1.57 µg/m³ and R² 0.249. The sign is consistent with a decline over the period, but the descriptive R² indicates a limited fit to the year-to-year changes. The 2020 and 2022 means, for example, are higher than the 2018 one.
Figure 2
The comparison is between three monitoring stations. The concentration measured at a point depends on the local setting, the weather and the sources. Estimating the exposure of the whole population of Lombardy would require a different method with territorial coverage and population weights.
Data to reproduce the analysis
Air Quality · Data and Methods · Back to the five-studies project