

Seasonality and High-Concentration Days
Annual means smooth out high-concentration episodes. Separating the underlying trend, seasonality and critical days takes three readings of the same data.
Comparing the same days
For the monthly profile we used only the dates with a valid measurement at all three stations. The average February of the period measures about 42.3 µg/m³ in Bergamo, 48.0 in Mantua and 48.1 in Pavia. In May the values are about 16.4, 15.7 and 19.8. The profile summarizes all the years 2018–2025, with 215 common days for February and 240 for May. The distribution of gaps can be read from the daily CSV.
Figure 1
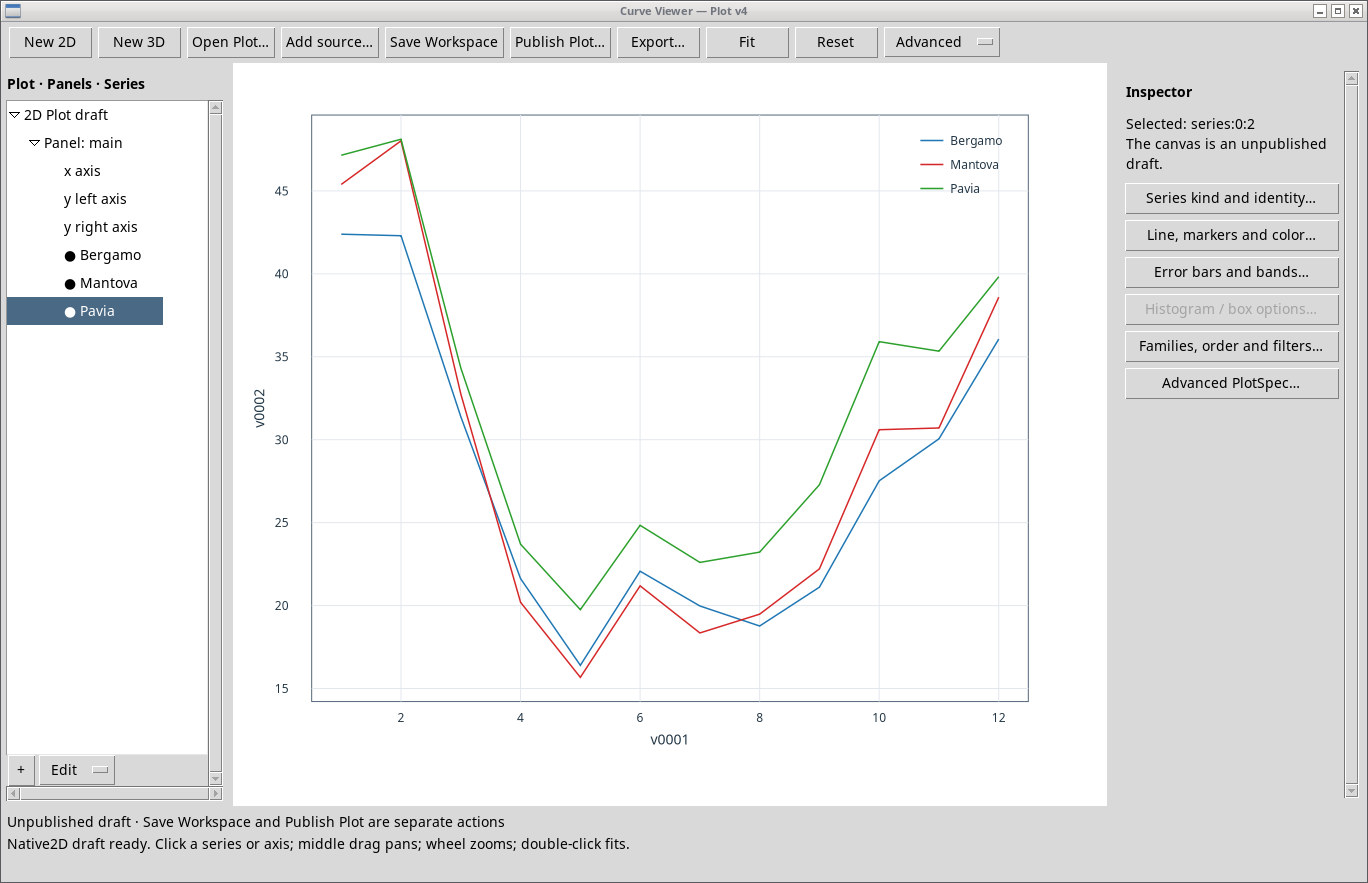
To check the spread as well, we ran Grouped Statistics on the 2,734 common days in Bergamo. From January to May the median goes from 37 to 16 µg/m³ and the interquartile range narrows from 28 to 9 µg/m³. In January the maximum on common days reaches 176 µg/m³. High episodes become visible when the median, quartiles and maximum are compared with the monthly mean. Report produced by GX-TXT · Download the report (.zip).
How many days exceed 50 µg/m³
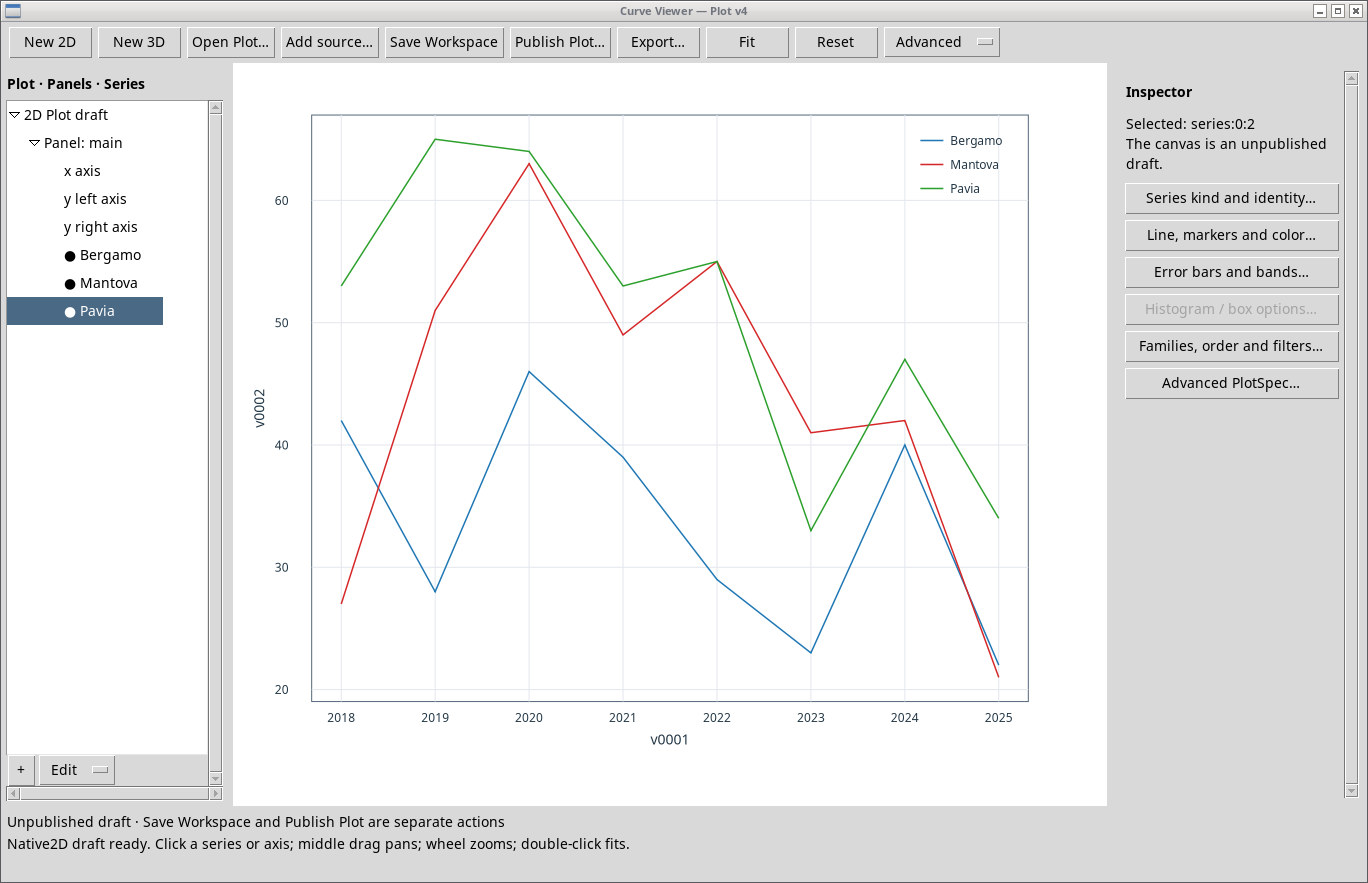
In 2025 we count 22 days above 50 µg/m³ in Bergamo, 21 in Mantua and 34 in Pavia. Valid days are 360, 361 and 360 respectively. In 2019 Pavia had 65 out of 358. We use a strictly-greater-than-50 comparison, consistent with the daily quantity. A day without a measurement is left out of the count. European reference for the daily PM10 value.
Figure 2
Seasons with temperature inversions and poor ventilation can favor accumulation, but this series cannot separate the effects of weather, emissions, heating and transport. A compliance analysis would also require the official validation and assessment criteria. Here we report reproducible counts of the available measurements.
Data to reproduce the analysis
Air Quality · Data and Methods · Back to the five-studies project