

Signal quality and correlations
These methods can also work without sampling frequency. Choose Scientific Dataset and Primary measured signal. Indicate Measured time coordinate to check the time or leave the blank field to work for samples. For the three methods, the Job result can be read in the bottom pane.
quality.basic — descriptive signal metrics
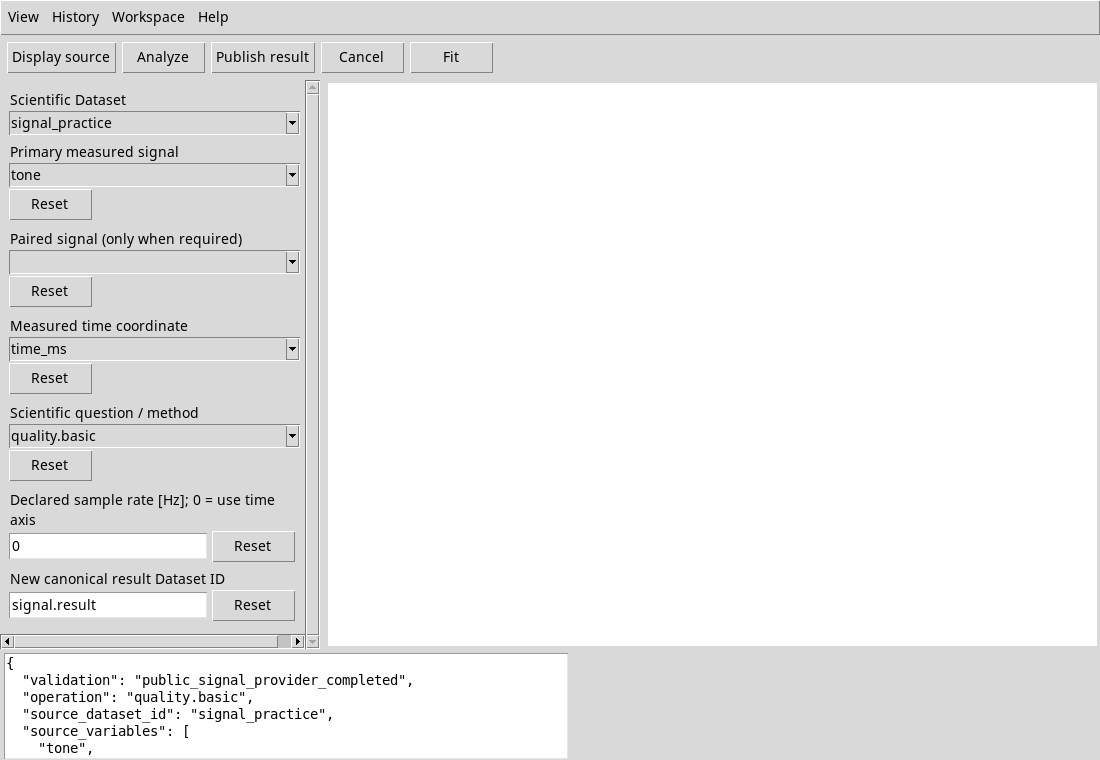
Choose quality.basic and select Analyze. Leave Paired signal (only when required) blank. This is the default method and has no additional settings. Check the report for scale, offset, and dynamic range before moving on to more specialized analyses.
- n
- Number of actual samples.
- rms
- Square root of the mean of the squared signal, expressed in the signal unit. For a unit-amplitude sine wave, RMS is approximately 0.7071.
- peak and peak_to_peak
- Maximum absolute value and difference between the maximum and minimum of the real signal, both in the signal unit. For a unit-amplitude sine wave, these are 1 and 2, respectively.
- crest_factor
- Peak/RMS adimensional ratio. A high value signals large peaks compared to the RMS level. For an identically null signal, the ratio is undefined.
- dc_real and dc_imaginary
- Average of the real and imaginary component. For the real source, the imaginary component is zero. The real average measures the offset in the chosen section.
- input_kind and method
- Type of data and name of the definition used. They do not express a classification of suitability.
The method produces a scalar summary with columns: []. Publish result returns This operation has no vector table. The result remains in the viewer panel and in the summary output of Job.
Correlation normalization
The field appears for correlation.auto and correlation.cross. The sum only affects overlapping pairs at each lag. The signal average is not subtracted, so an offset can dominate the correlation.
- none
- Unnormalized sum of the products. Useful if it counts the physical scale of the product. Depends on the number of contributions.
- biased
- Divide the sum to the total number N of samples per channel. Lags with few overlapping pairs are attenuated.
- unbiased
- Divides by N−|lag|. Very few pairs may overlap at extreme lags. Peaks far from zero may depend on these few points.
- coefficient
- Default. Divides by the square root of the product of the energies of the two signals. The scale is dimensionless. The energies must be nonzero, and the maximum cross-correlation may be below 1. Reset restores this setting.
correlation.auto — autocorrelation
Select the primary signal and leave the paired channel blank. Set Correlation normalization, then select Analyze. The method compares the signal with a shifted copy of itself. Look for recurring peaks on both sides of zero to identify periodicity. For tone at 32 Hz sampled at 256 Hz, the period is 8 samples. With coefficient normalization, the autocorrelation at zero lag is 1.
The table contains lags in samples, plus value_real and value_imaginary. For 1,024 rows, it returns 2,047 lags from −1,023 to +1,023. The imaginary part is zero for real sources. The lag unit is recorded as 1 and the value units are blank. Check the summary for delay_seconds when available. With a known rate, divide lag in samples by the rate to obtain seconds.
correlation.cross — cross-correlation
Choose two distinct variables and line per line in the same Dataset. The first signal is Primary, the second Paired. Press Analyze and look at the greatest correlation in absolute value. The product uses the conjugate of the second signal. In the viewer convention, with drive as primary and delayed as coupled, the peak is at −7 samples (−0.02734375 s at 256 Hz). Inverting the channels you reverse the sign. Use the sign of the real part to distinguish resemblance and anti-relation in real data.
peak_policy indicates that a tie selects the first absolute maximum in ascending lag order. Periodic paired signals can have nearly equal peaks. Limits interpretation to physically plausible delays. Columns and units follow those of self-correlation. Without rate the lags column remains in samples and the summary omits the conversion in seconds.