

High Fidelity or Placebo? The Mystery of Frequencies We (Maybe) Can’t Hear
There is a long-standing controversy, now back in the spotlight, over the use and usefulness of high frequencies above 20 kHz in high-resolution formats, music production, and hi-fi systems.
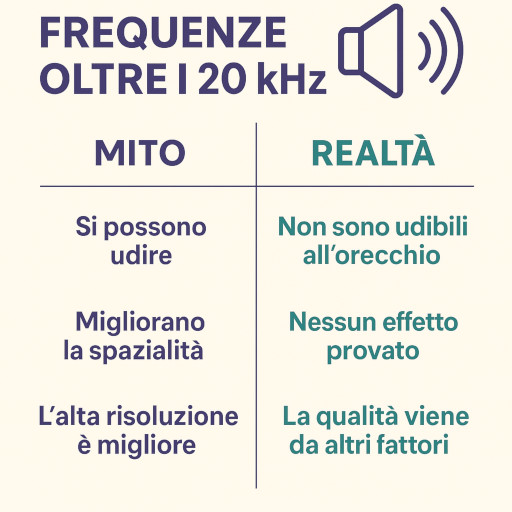
The audible range: theory and practical limits
The range of frequencies that the human ear can perceive, known as the audible range, theoretically extends from 20 Hz to 20,000 Hz (20 kHz). However, this interval represents an ideal limit, mainly applicable to young people under optimal conditions.
In practice, hearing sensitivity at high frequencies decreases with age (presbycusis) and with exposure to loud noise over a lifetime. By around the age of 30, many people already begin to have difficulty perceiving frequencies above 16 kHz, and only a small percentage can distinguish sounds above 18 kHz. After the age of 50, the upper threshold may fall below 14–15 kHz.
It is important to distinguish between conscious perception and physiological response. Frequencies above 20 kHz (ultrasound) are not perceived as audible sounds. The human auditory system, in fact, does not have the mechanical and neural ability to effectively transduce sound waves beyond this threshold into consciously perceived signals. Possible physical or subjective effects of ultrasound, such as discomfort or pressure, are not related to auditory perception itself, but to secondary phenomena such as tissue vibration or intermodulation in the presence of electronic devices.
In summary, we can say that:
- 20 Hz – 20 kHz is the theoretical audible range for humans;
- 20 Hz – 16/18 kHz is more realistic for most adults;
- >20 kHz is outside the range of conscious perception and is not heard as sound.
Fletcher-Munson curves

These loudness curves illustrate how the sensitivity of the human ear varies as a function of frequency and sound pressure level.
An equal-loudness contour graphically represents which combinations of frequency and sound pressure level (dB SPL) are perceived by the human ear as equally loud.
Imagine listening to a pure 1,000 Hz tone at an intensity of 40 dB SPL (decibels Sound Pressure Level). For every other frequency, the curves tell us at what intensity (in dB SPL) a tone should be reproduced for it to be perceived by the same person as “equally loud” as that 1,000 Hz tone.
In particular, they show that the ear is most sensitive to frequencies between 2,000 and 5,000 Hz, requiring lower sound pressure levels for sounds in this range to be perceived as equally loud compared with other frequencies.
The figure shows two groups of curves: Fletcher-Munson vs ISO 226:2003:
Fletcher-Munson curves (1933, 1937): these were the first experimentally determined equal-loudness contours, obtained in the 1930s by Harvey Fletcher and Wilden A. Munson at Bell Labs. The data were based on tests conducted on a relatively small number of subjects (about 20 people), and the measurements were less precise, but they laid the foundations of modern psychoacoustics. They are often shown for historical or educational purposes.
ISO 226:2003 curves: these are the curves currently recognized internationally (ISO = International Organization for Standardization), published in 2003 and resulting from extensive data collection by several international laboratories involving a very large and diverse sample of subjects. They are mathematically defined and more accurate in representing average human sensitivity to sound, and they constitute the official standard for technical, engineering, and medical applications.
The axes of the curves represent:
- Horizontal: sound frequency in Hz (logarithmic scale).
- Vertical: sound pressure level in dB SPL.
Each curve represents a level of subjective loudness perception (phon), where:
- 1 phon is the perceived loudness of a 1 kHz tone at 1 dB SPL.
- 40 phons, 60 phons, etc. indicate sounds perceived as progressively louder.
Practical example:
- A 40-phon contour means: “All points on this curve sound like 40 phons, that is, like a 1,000 Hz sound at 40 dB SPL”.
- To obtain 40 phons at 100 Hz, about 60 dB SPL is required.
- To obtain 40 phons at 5,000 Hz, 35 dB SPL is sufficient.
With age or hearing damage (presbycusis), equal-loudness contours rise at high frequencies: much higher sound levels are required to perceive sounds above 10–12 kHz. This is why people over 30 often have difficulty perceiving sounds above 16–18 kHz.
Here are some links for further reading:
- Equal-loudness-level contours for pure tones” – Yôiti Suzuki & Hisashi Takeshima
Journal of the Acoustical Society of America - “Comparison of equal-loudness-level contours between otologically normal young and older adults” – Kenji Kurakata et al. Acoustical Science and Technology
Effect of ultrasonic content
Some studies and marketing claims suggest that even if we do not “hear” those frequencies, they influence sound perception, spatial impression, or provide a sense of realism.
This theory is known as the “ultrasonic content effect”.
A frequently cited study is that of Oohashi et al. (2000):
- Some subjects reportedly responded positively to the presence of frequencies >20 kHz
- Only a small portion of the sample appeared able to distinguish the difference
- But the issue is highly controversial because of psychological bias, the listening environment, and playback quality
But what does audio science tell us?
It confirms that above 20 kHz the ear does not consciously perceive sound. In some high-resolution recordings, the sound may appear better, but for other reasons (a better DAC, a different mix, less compression, placebo, etc.). There may also be potential problems: “ultra” high frequencies can generate intermodulation distortion in non-ideal converters and amplifiers, can stress tweeters, or cause unwanted effects in crossovers.
The question of whether ultrasonic frequencies (above 20 kHz) influence human perception has been the subject of numerous studies, some of which question the existence of significant effects. Here are several studies reporting conflicting or negative results:
- “High-frequency sound components of high-resolution audio are not detected in auditory sensory memory“ (2020) by Hiroshi Nittono: This study examined whether the high-frequency components of high-resolution audio are detected in auditory sensory memory. The results indicated that these components were not detected, suggesting that they may not have a significant impact on auditory perception.
- “Effects of very high-frequency sound and ultrasound on humans. Part I: Adverse symptoms after exposure to audible very-high frequency sound“ (2018) by Mark D. Fletcher et al.: In this study, participants were exposed to very high-frequency sound (VHFS) and ultrasound (US). The results showed that exposure to audible VHFS can cause adverse symptoms such as headaches and fatigue, without demonstrating positive effects on perception or well-being.
- “Perceptual discrimination between musical sounds with and without very high frequency components“ (2003) by Toshiyuki Nishiguchi et al.: This study evaluated subjects’ ability to discriminate between musical sounds with and without very high-frequency components. The results indicated that participants were unable to reliably distinguish between the two types of sound, suggesting that very high-frequency components may not significantly affect musical perception.
These studies contribute to the scientific debate on the effects of ultrasonic frequencies, indicating that they may not have a significant or positive impact on human auditory perception.
High-resolution audio formats
High-resolution audio formats (or hi-res audio) are digital sound encoding systems that exceed the specifications of the CD standard (44.1 kHz / 16 bit), offering higher sampling rates and greater bit depth.
Common examples of hi-res formats:
- 96 kHz / 24 bit
- 192 kHz / 24 bit
- DSD (Direct Stream Digital): used in SACDs, with a different encoding approach (1 bit at very high frequencies, e.g. 2.8 MHz)
Sampling frequency (sample rate): this is the number of samples per second used to represent a digital audio signal. According to the Nyquist-Shannon sampling theorem, a system can faithfully represent frequencies up to half the sample rate.
Therefore:
- 44.1 kHz → can contain frequencies up to 22.05 kHz
- 96 kHz → up to 48 kHz
- 192 kHz → up to 96 kHz
Bit depth: defines the signal’s dynamic range (the difference between the quietest and loudest sounds).
A 16-bit file can represent about 96 dB of dynamic range, while a 24-bit file reaches about 144 dB, well beyond the range of human hearing (typically <120 dB under ideal conditions).
Supporters of high-resolution audio argue that:
- The sound is more open and airy, especially in acoustically rich material such as orchestral music.
- There is a greater sense of “naturalness” and presence, especially with acoustic instruments.
- It is less fatiguing during extended listening, thanks to more accurate reconstruction of transients and spatial information.
- DACs (digital-to-analog converters) work better at 24 bit because they require less dithering and reduce quantization distortion.
Skeptics question the perceived benefits:
- Human hearing does not perceive sounds above 20 kHz, so sampling at 96 or 192 kHz would be of little practical use.
- Perceived differences may be psychoacoustic effects or expectation bias.
- High-resolution audio increases the risk of artifacts such as:
- ultrasonic intermodulation in analog converters (produced by components that do not handle signals above 20 kHz well),
- aliasing if the system does not implement high-quality digital filters.
- Many DACs perform best at 44.1 or 48 kHz, while very high sample rates may introduce jitter or out-of-band distortion.
In summary
| Characteristic | Standard audio (CD) | High-resolution audio |
|---|---|---|
| Sample rate | 44.1 kHz | 96 kHz, 192 kHz, DSD |
| Bit depth | 16 bit (~96 dB) | 24 bit (~144 dB) |
| Audio bandwidth | up to ~22 kHz | up to 48–96 kHz |
| Covers human hearing? | Yes | Yes (with a wide margin) |
| Subjective benefits | Standard is sufficient | Perception of greater “air” |
| Technical risks | Minimal | Intermodulation / aliasing |
Conclusion
High-resolution audio can offer technical and subjective advantages, especially on high-end hi-fi systems. However, it is not automatically “better”, and the benefit depends on the listener, equipment, and listening context. The best approach is to experiment personally and evaluate it according to your own hearing and needs.