

GX-TXT-v3: Sensitivity, Threshold, and Output Chain Characterization
Introduction
The GX-TXT-v3 is a small instrument designed to test the operation of infrared remote controls. The circuit detects the signal received by the photodiode, amplifies its useful component, and drives an indicator LED, with adjustable gain and sensitivity. A timer also provides automatic power-off after a few seconds to reduce battery consumption.
In this series of articles I am following step by step the construction and, above all, the experimental characterization of the circuit, comparing the behavior of the real board with the LTspice simulation whenever useful.
The construction of the GX-TXT-v3 PCB and the first project checks are described in the previous articles; I started here:
Measurement objective
After characterizing the virtual photodiode, the VIR node, and the preamplifier gain adjustment, I continue the measurements on the GX-TXT-v3, following the signal through the next section of the circuit.
At this stage, the objective is to observe how the POT_SENS adjustment interacts with the gain set by POT_GAIN and how the signal propagates through the threshold network, the QIN stage, the HOLD circuit, and finally the orange LED drive.
To make all measurements comparable, I keep the virtual photodiode unchanged and use an equivalent photocurrent of about 20 µA. This value should not be interpreted as a universal characteristic of an IR remote control: in practice, the current generated by a photodiode depends on the device used, the distance and angle relative to the remote control, the power emitted by the infrared LED, and the operating conditions of the transmitter.
The 20 µA value is therefore simply a reasonable reference chosen for the basic characterization of the circuit. By keeping this excitation constant, I can vary only the two GX-TXT-v3 adjustments in a controlled way and observe the behavior of the different stages under the same conditions.
The test is organized using three POT_GAIN positions, close to 0 Ω, 500 Ω, and 1 kΩ. For each position, several POT_SENS values are then explored along its travel. Since these are real single-turn trimmers, the tables always report the actual measured values rather than assuming identical nominal positions from one series to another.
For each combination I observe the voltage at the V_TRHESHOLD node, the behavior of the QIN collector, the voltage accumulated at the HOLD node, and the level at N_LED_ARANCIO, from which the LED drive current can also be calculated. Where useful, the real measurements are compared with the corresponding LTspice simulation.
Measurement-point correspondence
In the LTspice simulation, some nodes have names used mainly to make the analysis easier to read. In the schematic and on the PCB, the same points may instead be identified by the signal name, component reference, or test point. The following table shows the correspondences used for the measurements in this article.
| LTspice name | Circuit reference | Measurement point |
|---|---|---|
| V_TRHESHOLD | INPUT | D3 cathode (D_THRESHOLD) |
| QIN_C | Q6 (QIN) collector | Q6 collector |
| HOLD | HOLD | Test point TP3 |
| N_LED_ARANCIO | Orange LED supply branch | Node at R23 |
For the other labels and for a more complete description of the different GX-TXT-v3 stages, see the previous article, where the schematic and the main board measurement points were presented.
Test conditions and meaning of the comparison
For this series of measurements I keep POT_GAIN fixed and progressively vary POT_SENS, observing the INPUT node, the Q6 collector, HOLD, and the orange LED drive circuit. The trimmer values reported are those actually measured with the OWON XDM2041, using its 50 kΩ range.
The voltages at the HOLD node and at the orange LED supply node were instead measured with the same multimeter on the 5 V range. The waveforms at the INPUT node and at the Q6 collector were observed with the oscilloscope.
Throughout all tests, the virtual photodiode is kept under the same previously characterized conditions, corresponding to a photocurrent of about 20 µA. Frequency, duty cycle, and all other circuit components also remain unchanged: the only variables in the measurement campaign are therefore POT_GAIN and POT_SENS.
It is important, however, to clarify that at this stage the circuit is driven by a continuous and persistent pulse train. This is therefore not a time-domain reproduction of a real command from a remote control, which normally occupies a window of only a few milliseconds and consists of bursts and pauses according to the protocol being used.
Consequently, the fact that under a given condition the HOLD node can progressively charge and the orange LED eventually turns on does not necessarily imply that the same will happen with a real command. This test is intended mainly to characterize the response of the different stages and to determine how the adjustments modify signal propagation along the chain.
The comparison with LTspice is therefore used mainly as a qualitative and indicative quantitative reference. This is especially true for HOLD: under near-threshold conditions the capacitor may charge very slowly, and the value obtained in simulation also depends on the simulation duration itself. Where necessary I extended the transient analysis, while in cases where the circuit was clearly far from activation I kept the simulation shorter.
Actual trimmer values and sensitivity adjustment
In the simulations and tables I use, as far as possible, the actual measured trimmer values rather than simply their nominal values. This is particularly important for POT_SENS because it is not used as a simple variable resistor but as a voltage divider.
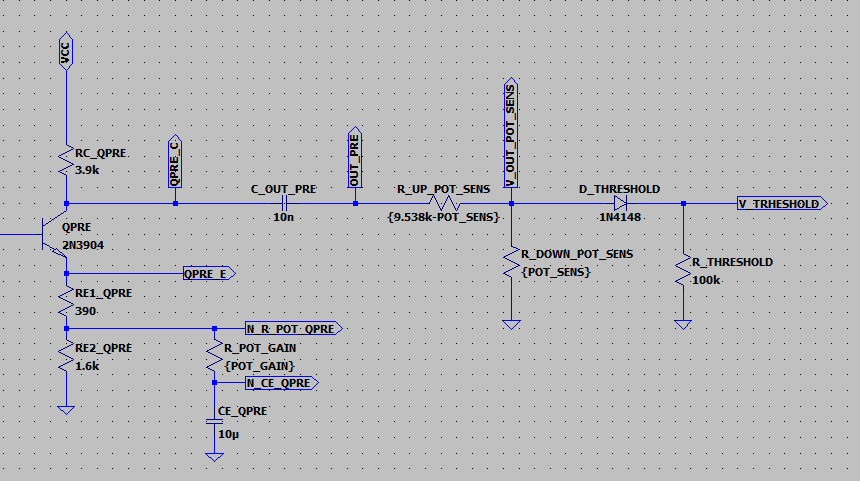
The trimmer mounted on the board has a measured total resistance of 9.538 kΩ. In the LTspice simulation, the divider is therefore represented by two complementary resistors: one equal to 9.538 kΩ – POT_SENS and the other equal to POT_SENS. The center node of the divider is V_OUT_POT_SENS.
RUP = 9.538 kΩ – POT_SENS
RDOWN = POT_SENS
The following schematic shows the part of the chain affected by this adjustment. The signal from the QPRE collector is coupled through C_OUT_PRE and applied to the POT_SENS divider. Moving POT_SENS toward 0 Ω progressively brings the wiper closer to ground and reduces the signal sent to the next stage; increasing POT_SENS, on the other hand, allows a progressively larger fraction of the signal from the preamplifier to reach D_THRESHOLD.
After the divider, diode D_THRESHOLD and the 100 kΩ resistor form the network feeding the INPUT node, identified in the simulation as V_TRHESHOLD. From this point onward the behavior becomes strongly nonlinear and is also determined by diode conduction and the following QIN stage.
A note on the QIN stage
Before comparing the results, it is useful to look at the AC biasing of the QIN stage, corresponding to Q6 in the schematic. The emitter branch includes a 22 Ω resistor and a 2 kΩ resistor, but the latter is bypassed by the 10 µF capacitor.
At the test frequency, about 38 kHz, the reactance of the 10 µF capacitor is below 1 Ω. From the AC point of view, the 2 kΩ resistor is therefore essentially bypassed and the emitter mainly sees the 22 Ω resistor, to which the transistor’s internal dynamic resistance must be added.
X_C = 1 / (2πfC) ≈ 0.42 Ω
QIN therefore operates with very little emitter degeneration and can provide very high AC gain. As a first approximation, its behavior can be described by the following relationship, neglecting the load applied to the collector:
A_v ≈ -R_C / (R_E + r_e)
With RC = 3.9 kΩ and RE = 22 Ω, even taking the dynamic emitter resistance into account, the available gain is very high. In practice, QIN was not designed as a stage intended to reproduce the waveform linearly: when a sufficiently large signal appears at its input, the collector swing rises rapidly to several volts and can approach the limits imposed by the transistor biasing.
This makes the comparison between simulation and real circuit particularly delicate when the signal at the INPUT node is very small. Even modest differences in the actual 2N3904 parameters, its bias current, VBE, current gain, and the characteristics of the input network can produce much larger variations at the collector.
For this reason I do not expect a precise match between LTspice and the real measurement under near-threshold conditions. The comparison is still useful for checking the overall trend of the stage and observing the transition from an almost negligible response to a large swing at the Q6 collector.
First measurement series: POT_GAIN ≈ 1 kΩ
The first series was carried out with a measured POT_GAIN value of 958.6 Ω, therefore with the minimum gain, while progressively varying POT_SENS over almost its entire range. The table summarizes the values measured at the main nodes in the chain and, where available, the corresponding behavior observed in simulation.
| Actual POT_SENS | Actual THRESHOLD | Actual Q6 collector | Actual HOLD | Actual N_LED | Approx. LTspice THRESHOLD | Approx. LTspice Q6 collector | Approx. LTspice HOLD | Approx. LTspice N_LED |
|---|---|---|---|---|---|---|---|---|
| 0.3 Ω | 0 | 0 | 0 V | VCC | ≈0 | ≈0 | ≈0 V | ≈VCC |
| 2.456 kΩ | ≈24.5 mV** | ≈0.30 Vpp | 0 V | VCC | ≈30 mV | ≈1 Vpp | a few mV | ≈VCC |
| 4.991 kΩ | 22–32 mV | ≈2.3 Vpp | 1.32 V | ≈2.9 V | ≈0.21–0.27 V | ≈3.2 Vpp | ≈2.3 V* | ≈2.0 V |
| 7.532 kΩ | 50–70 mV | ≈4.2 Vpp | 3.14 V | ≈2 V | ≈0.43–0.51 V | ≈4.5 Vpp | ≈3.1 V* | ≈2.0 V |
| 9.511 kΩ | ≈70 mVpp | ≈4.56 Vpp | ≈3.9 V | ≈2 V | ≈0.62–0.72 V | ≈4.5–4.6 Vpp | ≈3.3 V* | ≈2.0 V |
** THRESHOLD measured with the OWON multimeter, DC measurement
First measurement series in detail
After the summary table, let us look more closely at the individual points in the first series, carried out with POT_GAIN = 958.6 Ω while varying POT_SENS.
As a preliminary check, I also acquired the signal at the QPRE collector under two conditions, with POT_SENS equal to 0.0003 kΩ and 2.456 kΩ. In both cases the measured swing is about 2.28 Vpp. QPRE_C precedes C_OUT_PRE and the POT_SENS divider, so these acquisitions simply verify the signal available at the input of the sensitivity-adjustment network.


POT_SENS = 0.0003 kΩ
The first measurement was made with POT_SENS practically at zero. In this position the divider wiper is almost connected to ground and no measurable signal is present at the cathode of D3, that is, at the node identified in LTspice as V_TRHESHOLD.
I therefore did not acquire an oscilloscope trace of the threshold voltage: under this condition the value is essentially zero and there was no significant waveform worth documenting.
No appreciable signal-related variation is observed at the QIN collector either. With the OWON I measure HOLD = 0 V, while N_LED_ARANCIO remains at VCC: the orange LED is therefore off.
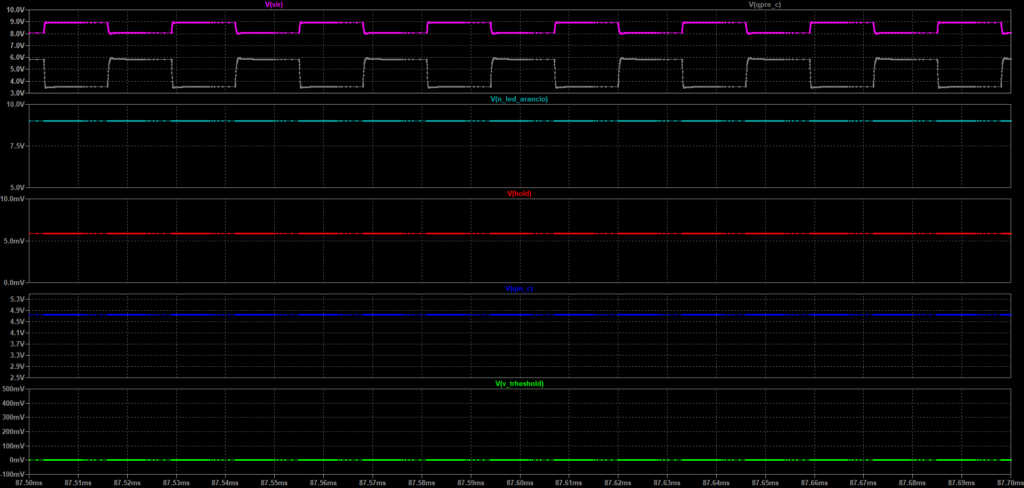
The LTspice simulation confirms the general behavior. V_TRHESHOLD remains practically at zero, QIN_C shows no significant response, HOLD remains almost completely discharged, and N_LED_ARANCIO stays close to the supply voltage.
POT_SENS = 2.456 kΩ
Increasing POT_SENS to 2.456 kΩ brings the circuit into the region where a response starts to appear after the threshold network. At the D3 cathode I measured a voltage of about 24.5 mV with the OWON.
In this case too I did not acquire a dedicated V_TRHESHOLD oscilloscope trace: the signal was still very small and there was not yet a sufficiently meaningful waveform to make an oscilloscope measurement useful.
At the QIN collector, however, a first clearly observable response appears, with a swing of about 304 mVpp. HOLD is still at 0 V and N_LED_ARANCIO remains at VCC, so the output chain is not activated.
The simulation also shows the beginning of the QIN response, but in this region the quantitative difference from the real circuit is quite evident: from the LTspice graph, the QIN_C swing is on the order of 1 Vpp, significantly larger than the measured value.
This is precisely one of the conditions in which the comparison must be interpreted with greater caution. As discussed earlier, QIN operates with very little emitter degeneration and high AC gain; when the signal from the threshold network is very small, relatively modest differences between the real transistor and the simulation model can produce much larger differences at the collector.

POT_SENS = 4.991 kΩ
With POT_SENS increased to 4.991 kΩ, the voltage at the D3 cathode becomes large enough to be observed directly with the oscilloscope.
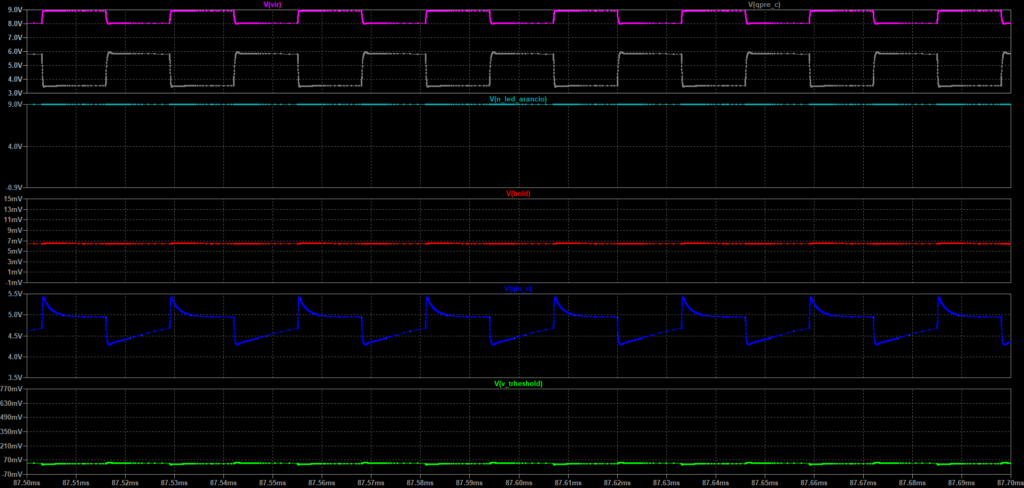
The V_TRHESHOLD waveform does not have a perfectly constant swing throughout the entire period; depending on the portion considered, I measure values ranging approximately from 21.6 to 32.4 mVpp.
These few tens of millivolts already produce a much larger response at the QIN collector, where I measure a swing of about 2.30 Vpp.
The response now also begins to propagate into the following section of the chain: with the OWON I measure about 1.32 V at the HOLD node and about 2.9 V at N_LED_ARANCIO.
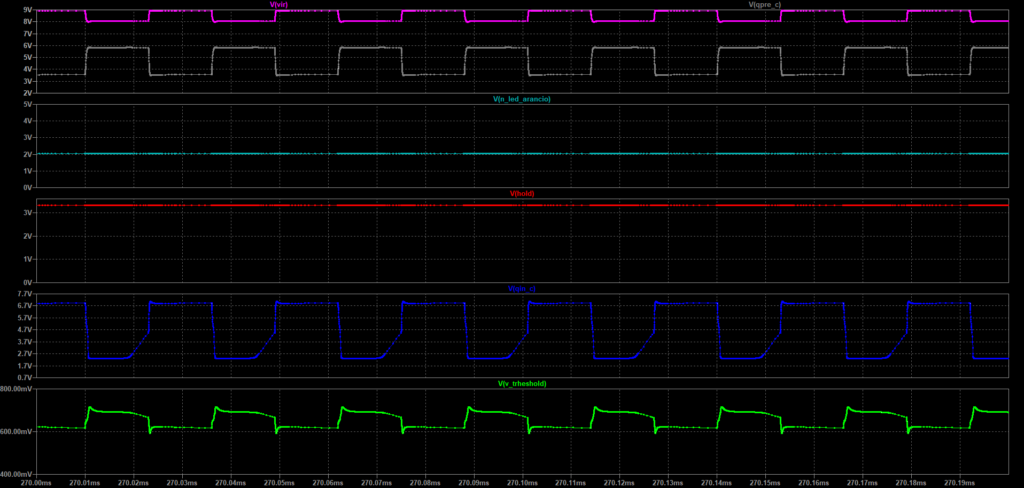
LTspice also shows the transition to a significant QIN response. In the simulated graph V_TRHESHOLD varies by a few tens of millivolts, while QIN_C reaches a swing on the order of 3 Vpp. The HOLD node also starts to charge and the voltage at N_LED_ARANCIO decreases.
The simulated HOLD values and the state reached by the LED branch should, however, be considered only indicative. In this characterization the circuit is driven by a continuous pulse train and, especially under near-threshold conditions, the voltage reached by HOLD also depends on the duration assigned to the simulation.


POT_SENS = 7.532 kΩ
Increasing POT_SENS to 7.532 kΩ further increases the signal at the D3 cathode. Here too the swing does not remain perfectly constant throughout the period, and I measure values ranging approximately from 51 to 68 mVpp.
At the QIN collector the response is now very large: the oscilloscope indicates about 4.20 Vpp. The stage has therefore clearly entered the strong-response region.
With the OWON I measure 3.14 V at the HOLD node and about 1.991 V at N_LED_ARANCIO. Under the persistent conditions used for this test, the circuit therefore drives the orange LED.
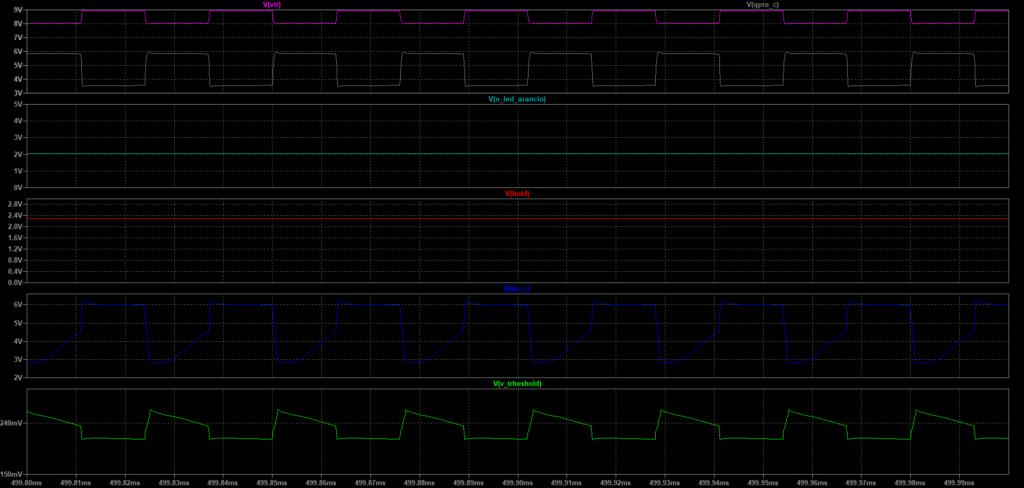
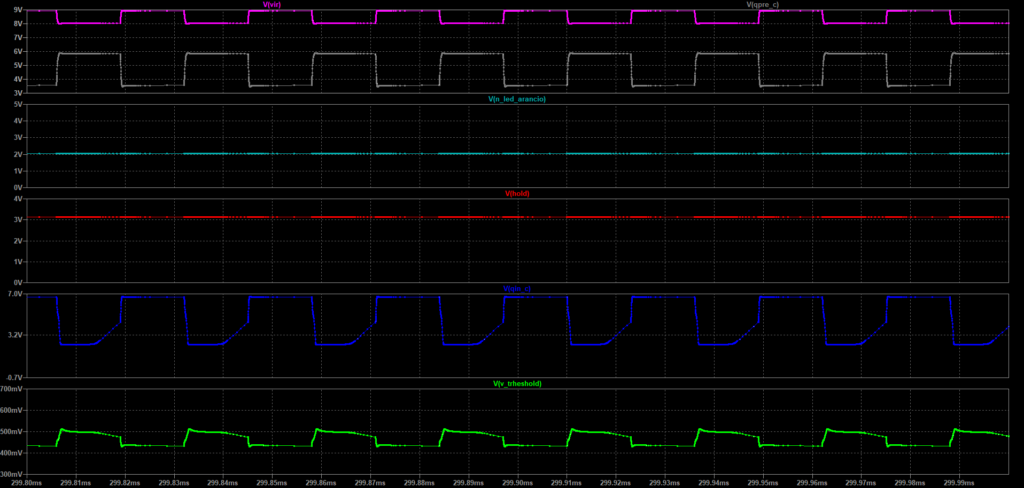
In this region the simulation and the real measurement are qualitatively much closer. LTspice shows a QIN_C swing on the order of 4.4 Vpp, a HOLD voltage around 3 V, and N_LED_ARANCIO close to 2 V.
The comparison of QIN behavior therefore becomes more meaningful once the very-small-signal region has been left behind. The caution already noted for HOLD and LED activation still applies, however, because both also depend on the excitation duration.


POT_SENS = 9.511 kΩ
The last point in the first series was acquired with POT_SENS = 9.511 kΩ, therefore very close to the measured total trimmer resistance of 9.538 kΩ.
At the V_TRHESHOLD node I measure a swing of about 72 mVpp. At the QIN collector the swing reaches about 4.56 Vpp.
The increase in QIN_C swing compared with the previous point is now relatively small: the stage is already being driven strongly and its behavior can no longer be interpreted simply as that of a linear small-signal amplifier.
At the HOLD node I measure about 3.9 V, while N_LED_ARANCIO is about 1.996 V. Under this condition too, the orange LED is therefore driven during the continuous excitation used for the characterization.
The simulation shows the same general behavior: the QIN_C swing is now on the order of 4.5 Vpp, HOLD reaches several volts, and N_LED_ARANCIO moves to around 2 V.
This test should not, however, be interpreted as a direct measurement of sensitivity to a real remote control. The virtual photodiode is supplying a continuous and persistent pulse train, whereas a real IR command consists of bursts occupying a time window of only a few milliseconds. The fact that HOLD can charge and the LED can turn on during this test therefore does not automatically imply that the same will occur under identical settings with a single real command.


Orange LED current
From the voltage measured at the N_LED_ARANCIO node it is also possible to calculate the current flowing through the orange LED. The LED is powered from VCC through the RLED 680 Ω resistor; using the measured VCC value of about 8.982 V, the current can therefore be estimated from the voltage drop across the resistor.
ILED = (VCC – VN_LED_ARANCIO) / 680 Ω
The following table summarizes the result for the different POT_SENS values in the first measurement series. When N_LED_ARANCIO remains at VCC, the voltage drop across the resistor is zero and the LED is off; when the chain is activated, the current rises rapidly until it settles at around 10 mA.
| POT_SENS | N_LED_ARANCIO | Orange I_LED |
|---|---|---|
| 0.0003 kΩ | VCC | 0 mA |
| 2.456 kΩ | VCC | 0 mA |
| 4.991 kΩ | ≈ 2.9 V | ≈ 8.9 mA |
| 7.532 kΩ | ≈ 2.0 V | ≈ 10.3 mA |
| 9.511 kΩ | ≈ 2.0 V | ≈ 10.3 mA |
A fairly sharp transition can therefore be seen: at the first two settings the LED remains off, while increasing POT_SENS first raises the current to about 8.9 mA and then to around 10.3 mA. Once the output stage is fully driven, further increases in sensitivity do not produce significant changes in LED current.
Second measurement series: POT_GAIN ≈ 500 Ω
The second series was carried out with a measured POT_GAIN value of 492.7 Ω, therefore with a gain setting close to mid-travel. Here too I progressively varied POT_SENS over almost its entire range, reporting the actual measured trimmer value for each point.
Compared with the first series, performed at minimum gain, the signal available downstream of the preamplifier is larger and makes it possible to observe how the response of the threshold network and the QIN stage changes as sensitivity increases. For all points, waveforms of V_TRHESHOLD and QIN_C were acquired; the HOLD and N_LED_ARANCIO voltages were instead measured with the OWON XDM2041.
| POT_SENS | V_TRHESHOLD | QIN_C | HOLD | N_LED_ARANCIO |
|---|---|---|---|---|
| 3 Ω | not directly quantifiable | not directly quantifiable | 0 V | VCC |
| 2.595 kΩ | ≈ 10.6 mVpp | ≈ 590–830 mVpp | 75 mV | VCC |
| 5.1145 kΩ | ≈ 42–62 mVpp | 3.960 Vpp | 2.83 V | ≈ 2.00 V |
| 7.584 kΩ | ≈ 76 mVpp | 4.480 Vpp | 3.559 V | ≈ 1.99 V |
| 9.429 kΩ | ≈ 85 mVpp | 4.880 Vpp | 3.88 V | ≈ 1.99 V |
At the point with POT_SENS at about 3 Ω, the waveforms were still acquired, but the useful signal is too small relative to the noise to assign a meaningful peak-to-peak value by simple visual reading of the trace. Extracting the component at the known frequency would require numerical processing of the acquisition, which is not necessary for the objectives of this test.
Second measurement series in detail
The waveforms make it possible to observe more clearly the transition that appears in the table only through numerical values. For each POT_SENS position I report the V_TRHESHOLD measurement at the D3 cathode, the response at the QIN collector, and the corresponding LTspice simulation result.
The comparison with simulation remains mainly indicative under near-threshold conditions and for HOLD values. Once QIN is driven strongly, however, the comparison of collector amplitudes becomes more meaningful.
POT_SENS = 3 Ω
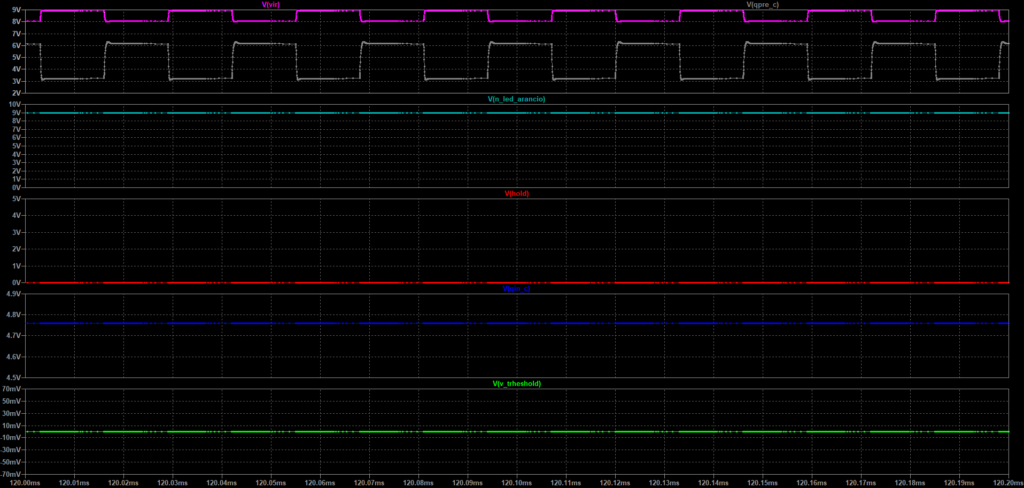
With POT_SENS practically at zero, only very small signals immersed in measurement noise are visible both at V_TRHESHOLD and at the QIN collector. The waveforms are useful for documenting this condition, but I do not consider it meaningful to derive a Vpp value directly from them.
HOLD remains at 0 V and N_LED_ARANCIO stays at VCC: the final section of the chain is therefore completely inactive. LTspice also returns essentially the same condition, with V_TRHESHOLD close to zero and no significant QIN response.


POT_SENS = 2.595 kΩ
Increasing POT_SENS to 2.595 kΩ causes a response clearly correlated with the injected signal to appear. At V_TRHESHOLD I measure a swing of about 10.6 mVpp.
At the QIN collector, the effect of the stage’s high gain is already evident. In the acquisition shown, the oscilloscope indicates about 590 mVpp; during the measurement I observed values ranging approximately between 590 and 830 mV.
The following chain is not yet fully activated, however. HOLD reaches only about 75 mV, while N_LED_ARANCIO remains at VCC and the orange LED stays off.
It is at this point that QIN’s sensitivity to small-signal conditions becomes especially evident. LTspice shows a collector response significantly larger than the measured one, on the order of 1.5-2 Vpp, while the LED branch still remains inactive.
The simulated HOLD value is also higher than the measured one. This comparison must again be interpreted with caution: we are very close to the region where small differences in QIN response are strongly amplified, and HOLD charging also depends on how long the pulse train is maintained.


POT_SENS = 5.1145 kΩ
With POT_SENS increased to 5.1145 kΩ, the behavior of the chain changes markedly. At V_TRHESHOLD, the oscilloscope measures about 57.6 mVpp in this acquisition; during observation, the value was not perfectly constant and remained approximately within the noted range of 42-62 mVpp.
At the QIN collector, the swing reaches 3.960 Vpp. Compared with the previous point, the stage has therefore moved from a still-partial response to a strong swing of several volts.
The final section of the circuit is now clearly active as well: HOLD reaches about 2.83 V and N_LED_ARANCIO moves to around 2.00 V, indicating that the orange LED is being driven under the persistent conditions used for this test.
In this region, the comparison with LTspice improves significantly. The simulation shows a V_TRHESHOLD swing of the same order of magnitude and a QIN_C variation slightly above 4 Vpp. HOLD also rises to around 3 V and N_LED_ARANCIO to around 2 V.
The correspondence is therefore not only qualitative: once the very-small-signal region has been exceeded, the amplitudes at the main nodes also become reasonably close between simulation and the real circuit.


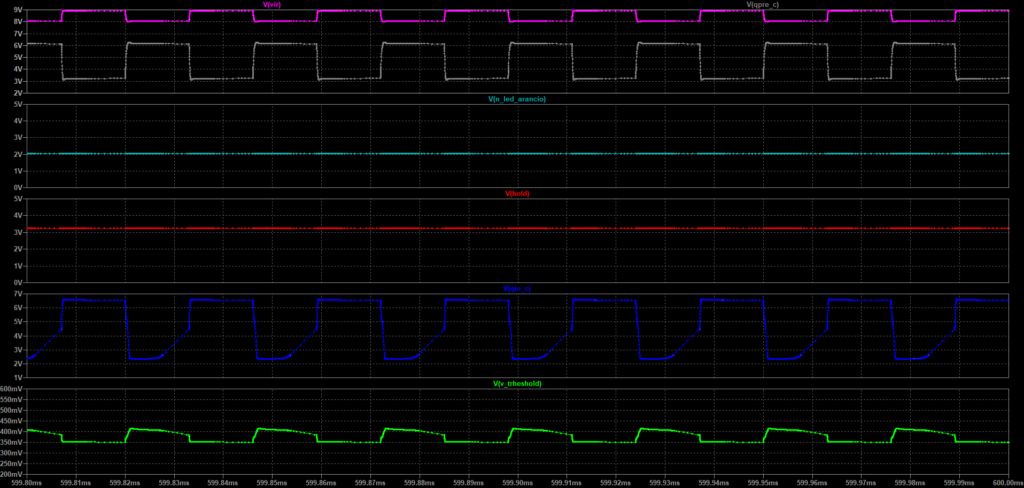
POT_SENS = 7.584 kΩ
Increasing POT_SENS to 7.584 kΩ raises the measured V_TRHESHOLD swing to about 76 mVpp.
At the QIN collector I measure about 4.480 Vpp. The stage is now strongly driven, and increasing POT_SENS produces a much less dramatic variation than the transition observed between 2.595 and 5.1145 kΩ.
HOLD reaches about 3.559 V, while N_LED_ARANCIO is close to 1.99 V. The LED drive is therefore fully active under the test condition.
LTspice shows the same trend, with V_TRHESHOLD on the order of a few tens of millivolts peak-to-peak, QIN_C close to a swing of about 5 Vpp, HOLD on the order of 4 V, and N_LED_ARANCIO near 2 V.


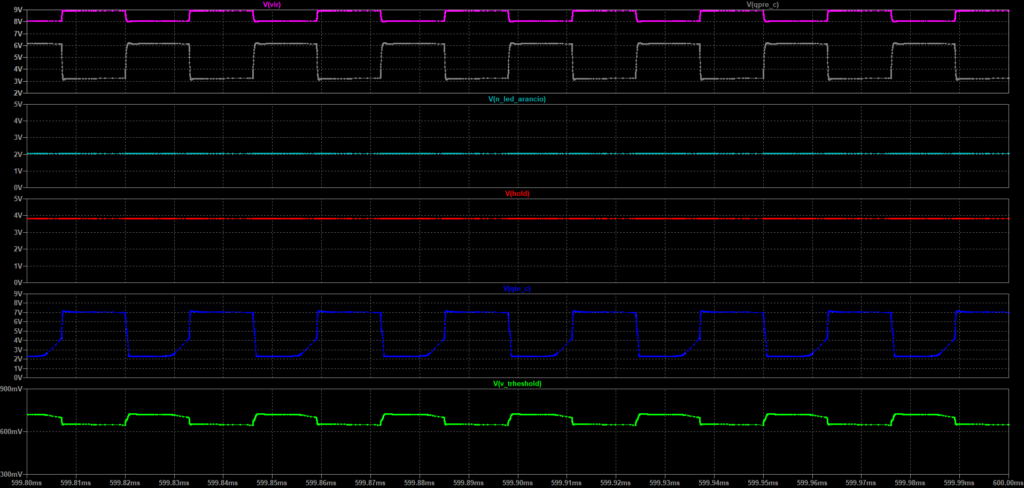
POT_SENS = 9.429 kΩ
The last point in the second series was acquired with POT_SENS equal to 9.429 kΩ, again very close to the upper end of the trimmer.
At V_TRHESHOLD I measure about 85 mVpp, while at the QIN collector the swing reaches about 4.880 Vpp. Compared with the previous two points, QIN continues to increase its swing, but the variation is now much smaller than the abrupt transition observed in the middle region of the adjustment.
At the HOLD node I measure about 3.88 V and N_LED_ARANCIO remains around 1.99 V. The output branch is therefore fully driven.
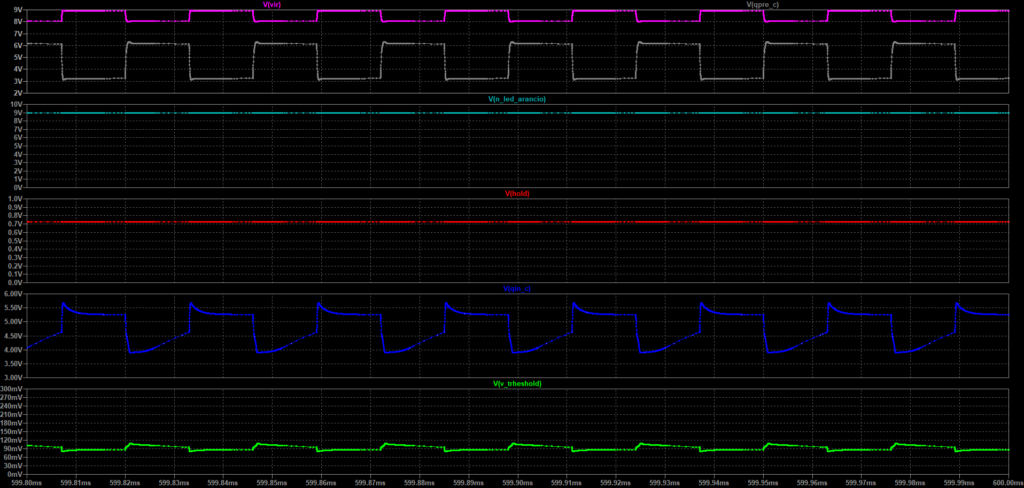
LTspice again returns the same general behavior, although with slightly larger amplitudes: V_TRHESHOLD is on the order of one hundred millivolts peak-to-peak and QIN_C exceeds approximately 5 Vpp. HOLD also reaches a value higher than that measured on the real circuit.
This last difference does not change the meaning of the test. HOLD is charged by a pulse train artificially maintained over time, and the simulated value also depends on the duration of the transient analysis. The main objective of this series is to observe how the chain response changes as POT_SENS varies, not to determine from these artificial conditions the exact duration or turn-on threshold with a real remote control.


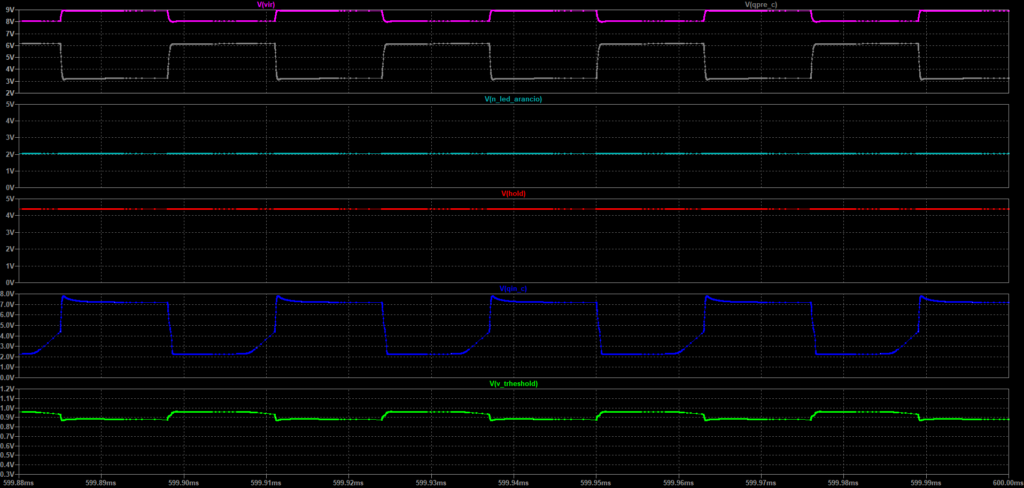
The second series makes the transition of the chain with increasing POT_SENS especially clear. With the trimmer practically at zero, only signals on the order of a few millivolts are observed; at 2.595 kΩ, QIN already begins to produce a response on the order of several hundred millivolts, while around 5 kΩ its swing rises rapidly to almost 4 Vpp and significant charging of HOLD begins.
From this point onward, increasing POT_SENS continues to increase the response, but QIN is already operating with a large swing and the variation at the collector becomes progressively less pronounced. The comparison with LTspice also shows that the largest differences are concentrated precisely in the small-signal region, while once QIN is strongly driven the simulated and real behavior become much closer.
Orange LED current
For this second series as well, the orange LED current can be calculated from the voltage measured at N_LED_ARANCIO. Using VCC equal to about 8.982 V and the 680 Ω RLED resistor, the current is estimated from the voltage drop across the resistor.
ILED = (VCC – VN_LED_ARANCIO) / 680 Ω
| POT_SENS | N_LED_ARANCIO | Orange I_LED |
|---|---|---|
| 3 Ω | VCC | 0 mA |
| 2.595 kΩ | VCC | 0 mA |
| 5.1145 kΩ | ≈ 2.00 V | ≈ 10.27 mA |
| 7.584 kΩ | ≈ 1.99 V | ≈ 10.28 mA |
| 9.429 kΩ | ≈ 1.99 V | ≈ 10.28 mA |
With POT_GAIN set to 492.7 Ω, the output behavior is again very sharp. At the first two points the LED remains off; when the QIN response becomes sufficiently large and HOLD can charge, the LED current rises rapidly to about 10.3 mA.
Once this condition has been reached, further increases in POT_SENS produce negligible changes in LED current. The sensitivity adjustment therefore acts mainly on reaching the condition required to activate the chain, while once the output is fully driven, the LED current is essentially determined by its supply branch.
Third measurement series: POT_GAIN ≈ 0 Ω
The third series was carried out by moving POT_GAIN close to the minimum available value. The actual measured resistance is about 5 Ω, a condition corresponding to the maximum preamplifier gain.
As in the previous series, I progressively varied POT_SENS over almost its entire range, reporting the actual measured trimmer values. For each point, the V_TRHESHOLD node at the D3 cathode and the QIN collector were observed with the oscilloscope; HOLD and N_LED_ARANCIO were instead measured with the OWON XDM2041.
The following table collects the experimental results. For this series too, the comparison with LTspice should be considered mainly as a reference for the overall trend of the chain, especially under near-threshold conditions and for the value reached by HOLD.
| POT_SENS | V_TRHESHOLD | QIN_C | HOLD | N_LED_ARANCIO |
|---|---|---|---|---|
| 3 Ω | not directly quantifiable | not directly quantifiable | 0 V | VCC |
| 2.595 kΩ | ≈ 29.2–46.8 mVpp | 3.140 Vpp | 2.126 V | 2.02 V |
| 4.915 kΩ | ≈ 75.8 mVpp | 2.160 Vpp | 3.74 V | 1.99 V |
| 7.495 kΩ | ≈ 93–100 mVpp | 5.360 Vpp | 4.37 V | 1.99 V |
| 9.632 kΩ | ≈ 104–118 mVpp | 5.800 Vpp | 4.75 V | 1.98 V |
In this series too, with POT_SENS practically at zero, the observed traces remain too small relative to the noise to assign a meaningful peak-to-peak value by simply reading the waveform. A numerical analysis could in principle extract the component at the known frequency, but it would not add useful information for the objectives of this characterization.
Detailed analysis of the individual points
The waveforms make it possible to follow directly how the signal passes through the sensitivity network and how the QIN response changes as POT_SENS increases. For each setting I report V_TRHESHOLD, QIN_C, and the corresponding LTspice simulation.
POT_SENS = 3 Ω
With POT_SENS practically at zero, the useful component present at V_TRHESHOLD is extremely small. At the QIN collector as well, it is not possible to obtain a meaningful Vpp value directly from the waveform: the traces are dominated by noise and by small residual components synchronized with the applied signal.
From the functional point of view, however, the condition is clear: HOLD remains at 0 V and N_LED_ARANCIO stays at VCC, so the output branch remains completely inactive. LTspice also returns essentially the same situation.


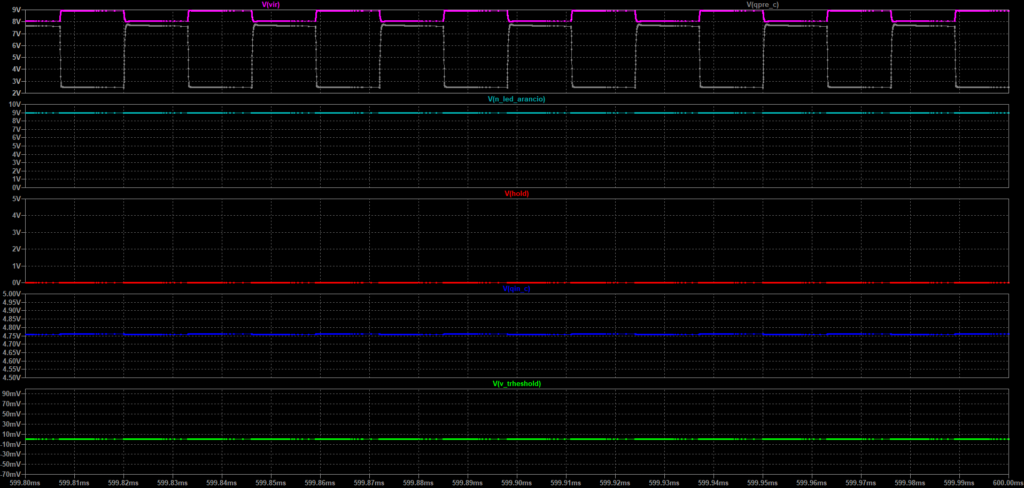
POT_SENS = 2.595 kΩ
With POT_SENS increased to 2.595 kΩ, the response becomes clearly observable. The V_TRHESHOLD waveform has a non-uniform swing, ranging approximately from 29.2 to 46.8 mVpp.
At the QIN collector, the effect of the stage’s high gain is already very pronounced: the swing reaches about 3.140 Vpp. The following part of the chain therefore also begins to be driven significantly.
At the HOLD node I measure about 2.126 V, while N_LED_ARANCIO falls to about 2.02 V. Under the continuous-excitation conditions used for this characterization, the orange LED is therefore already being driven.
The comparison with LTspice must still be interpreted cautiously in this region: QIN is rapidly moving from the small-signal condition to a large swing, and small differences between the real circuit and the model can produce significantly different results at the collector and, consequently, in the charging of HOLD.


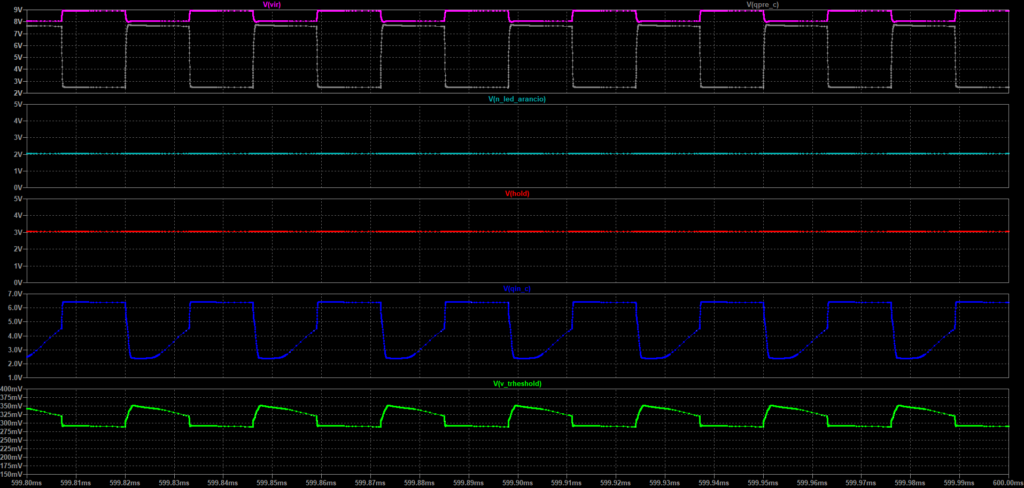
POT_SENS = 4.915 kΩ
With POT_SENS equal to 4.915 kΩ, I measure a swing of about 75.8 mVpp at V_TRHESHOLD.
At the QIN collector, the waveform gives about 2.160 Vpp under this condition. This value is not consistent with the overall trend of the series: it is lower than the value measured at the previous point, while both V_TRHESHOLD and HOLD continue to increase regularly. I cannot exclude that this depends on reading the swing of a waveform that is now strongly distorted, so it should be checked again in a dedicated measurement.
HOLD reaches about 3.74 V, while N_LED_ARANCIO is about 1.99 V. The output chain is therefore fully active during the continuous pulse train used in the test.
At this point too, the simulation is used mainly to verify the overall behavior of the chain rather than to assign significance to small differences in individual amplitudes.


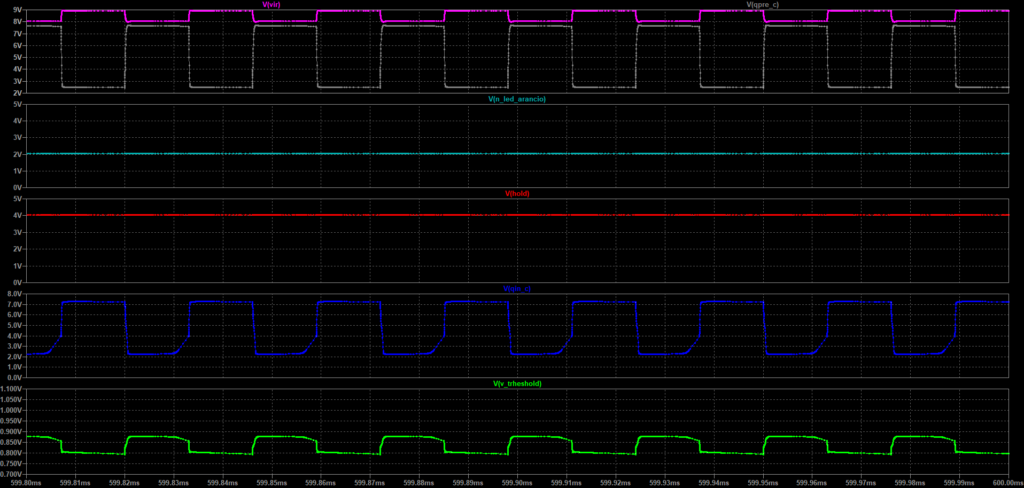
POT_SENS = 7.495 kΩ
Increasing POT_SENS to 7.495 kΩ further raises the voltage at V_TRHESHOLD. During the acquisition, the swing lies approximately between 93 and 100 mVpp.
At the QIN collector I measure about 5.360 Vpp. The stage is therefore strongly driven and now uses a very large portion of the available collector swing.
HOLD reaches about 4.37 V, while N_LED_ARANCIO remains around 1.99 V. The output is fully active.
In this region, the comparison with LTspice becomes easier to interpret again: both the real circuit and the simulation show QIN strongly driven, HOLD charged, and the LED branch conducting.


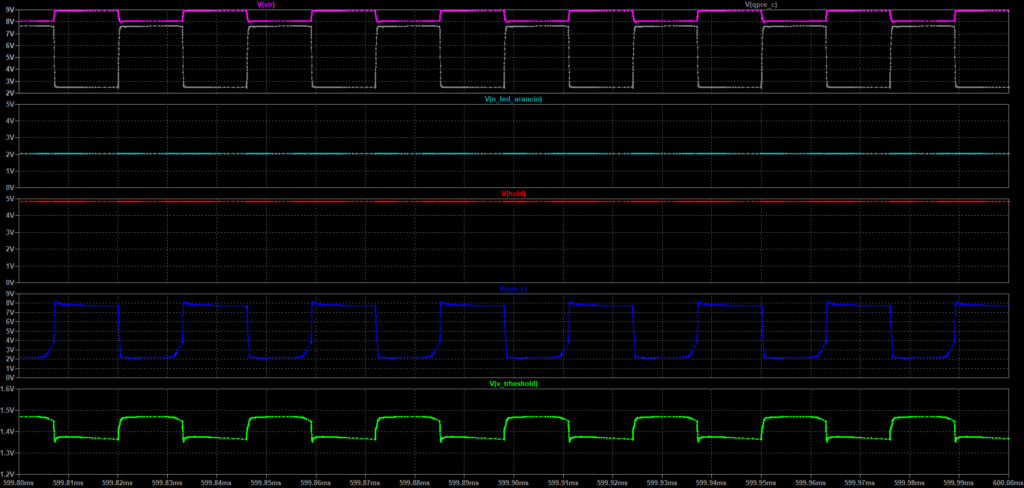
POT_SENS = 9.632 kΩ
The last point in the series was acquired with POT_SENS equal to 9.632 kΩ, therefore close to the upper end of the trimmer.
The voltage at V_TRHESHOLD has a swing approximately between 104 and 118 mVpp. At the QIN collector I measure about 5.800 Vpp, the highest value observed in this series.
At the HOLD node the voltage reaches about 4.75 V, while N_LED_ARANCIO moves to about 1.98 V. QIN and the following output chain are therefore fully driven under the persistent test conditions.
Here too, the comparison with LTspice mainly confirms the overall trend. HOLD values should not instead be used to directly predict behavior with a real remote control, because the excitation applied during this characterization is maintained much longer than a normal IR burst.


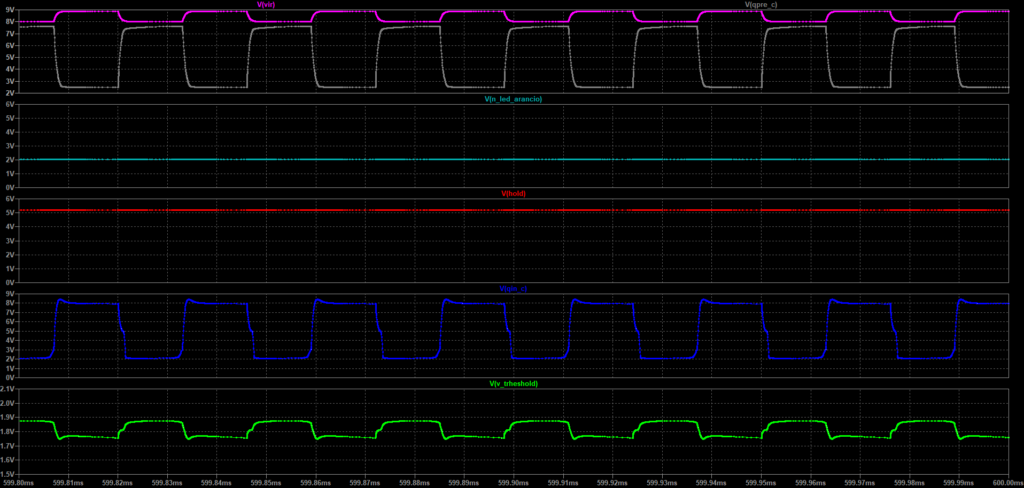
Orange LED current
As in the previous series, the current through the LED can be estimated from the voltage measured at N_LED_ARANCIO. Using VCC equal to about 8.982 V and RLED = 680 Ω:
ILED = (VCC – VN_LED_ARANCIO) / 680 Ω
| POT_SENS | N_LED_ARANCIO | Orange I_LED |
|---|---|---|
| 3 Ω | VCC | 0 mA |
| 2.595 kΩ | 2.02 V | ≈ 10.24 mA |
| 4.915 kΩ | 1.99 V | ≈ 10.28 mA |
| 7.495 kΩ | 1.99 V | ≈ 10.28 mA |
| 9.632 kΩ | 1.98 V | ≈ 10.30 mA |
With POT_GAIN close to the maximum-gain condition, the output transition occurs already at relatively low POT_SENS values. At 2.595 kΩ, the LED branch is already driven and the current reaches about 10.2 mA.
Once the chain is activated, the current remains practically constant around 10.3 mA. This third series therefore also confirms that POT_GAIN and POT_SENS mainly determine whether the activation condition is reached, while the final LED current is essentially set by its output circuit.
Combined effect of POT_GAIN and POT_SENS on HOLD voltage
The three measurement series can be combined into a single representation to immediately observe the combined effect of the gain and sensitivity adjustments. In all tests, the virtual photodiode was kept under the same conditions, with an equivalent photocurrent of about 20 µA.
In the following graph I therefore plot VHOLD as a function of POT_SENS for the three POT_GAIN values used during the characterization: 958.6 Ω, 492.7 Ω, and about 5 Ω. Each curve represents a series performed with POT_GAIN held constant.
Family of VHOLD–POT_SENS curves at constant POT_GAIN
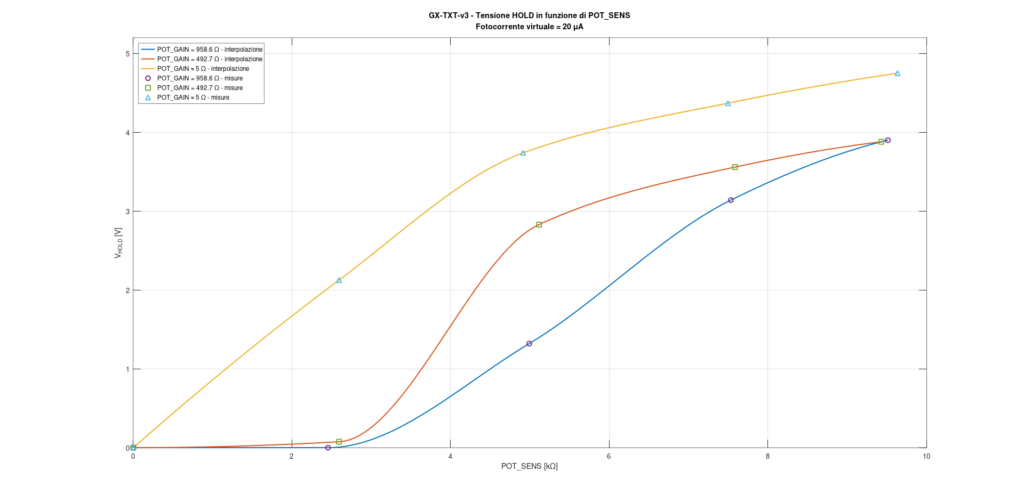
The graph clearly shows the shift in response as the gain changes. With POT_GAIN = 958.6 Ω, corresponding to the minimum-gain condition among those considered, POT_SENS must be increased further before HOLD begins to charge significantly.
With POT_GAIN set to 492.7 Ω, the curve shifts toward lower POT_SENS values, while with POT_GAIN close to 5 Ω, and therefore with the preamplifier set for maximum gain, significant HOLD charging appears already at relatively low POT_SENS values.
VHOLD is a particularly useful parameter for this representation. Since the C_HOLD capacitor remains unchanged throughout all tests, a higher voltage corresponds to a greater accumulated charge and, consequently, to greater energy stored in the capacitor. The graph therefore provides a concise representation of how effectively the signal propagates along the chain and feeds the accumulation process as the two adjustments are varied.
The symbols represent the actual measured experimental points, while the lines are obtained by PCHIP interpolation and are used exclusively as a visual guide. They do not represent a mathematical model derived from the circuit and therefore should not be used to extrapolate behavior outside the measured range.
The measurements also show that there is a certain HOLD level above which the circuit begins to drive the orange LED. At this stage, however, a true output threshold voltage has not been determined experimentally with sufficient precision; for this reason I preferred not to add an arbitrary LED turn-on line to the graph.
This characterization can be revisited later with denser measurements in the transition region, specifically determining the HOLD level at which LED drive begins. At that point, the same family of curves will also make it possible to estimate the POT_SENS value required to reach the threshold for each POT_GAIN setting.
Finally, it should be remembered that these curves describe the circuit under the specific test conditions: an equivalent photocurrent of about 20 µA and a continuous pulse train. They therefore do not directly represent the response to a single command from a real remote control, but rather provide a comparative characterization of the combined effect of POT_GAIN and POT_SENS.
Conclusions
With this measurement campaign, I consider the GX-TXT-v3 chain that carries the signal produced by the virtual photodiode through to the charging of the HOLD node and the subsequent drive of the orange LED to be characterized under the defined test conditions.
Throughout all tests, the equivalent photocurrent was kept at about 20 µA. This value was chosen as a reasonable reference, within the order of magnitude that can be produced by an illuminated IR photodiode, but it should not be interpreted as generally representative of a real remote control. The actual photocurrent depends on the photodiode used, the distance, the angle of incidence, the power emitted by the remote control’s infrared LED, and the operating conditions of the transmitter.
The excitation used during this characterization is also deliberately different from that produced by a real remote control. The virtual photodiode was driven with a continuous and persistent pulse train, whereas a real IR command consists of sequences of bursts and pauses distributed over a relatively short time window. Consequently, the fact that under a given setting HOLD can charge and the orange LED turns on does not necessarily imply that the same will occur with a single real command.
The purpose of these tests was therefore not to directly determine the GX-TXT-v3 sensitivity to a remote control, but to experimentally characterize the signal-processing chain while keeping the excitation known and constant. This made it possible to observe how the two POT_GAIN and POT_SENS adjustments interact, how the QIN stage response changes, and how this response is finally converted into charge stored in the HOLD capacitor.
The measurements also show the role of QIN particularly clearly. The stage has very high AC gain and progressively operates in a strongly nonlinear region: under conditions close to the onset of response, even small differences in the applied signal can produce very large variations at the collector. This explains why the differences between the real circuit and simulation are greatest precisely in the small-signal region, while the comparison generally becomes closer when QIN is driven decisively.
The most concise result of the characterization is the family of VHOLD–POT_SENS curves at constant POT_GAIN. The graph immediately shows how the two adjustments interact at the photocurrent used in this test: increasing the preamplifier gain means that a lower POT_SENS value is sufficient to obtain the same HOLD level, while reducing the gain requires higher POT_SENS values to reach the same condition. Because this is a strongly nonlinear chain, this relationship applies to the approximately 20 µA used here and cannot automatically be extended to other photocurrents.
Since C_HOLD remains unchanged, VHOLD is also a good indicator of the amount of accumulation achieved by the chain. The graph therefore provides a first overall experimental characterization of the amplification, sensitivity, and HOLD accumulation network, which is more meaningful than simply observing whether the LED is on or off.
The LTspice simulation proved useful mainly as a reference for understanding the overall circuit trend and comparing the different settings. An exact point-by-point match is not necessary under every condition, especially in the small-signal regions and for HOLD, where the result also depends on the excitation duration and therefore on the time available to accumulate charge.
These results provide a useful basis for a more specific subsequent characterization. It will be possible to increase the measurement density in the transition region, experimentally determine more precisely the HOLD level required to begin driving the LED, and, above all, replace the continuous pulse train used in these tests with time sequences closer to those produced by a real remote control. At that point it will be possible to move from characterization of the chain to a true characterization of the instrument’s response to realistic IR signals.