

A Century at the Surface of the Mediterranean
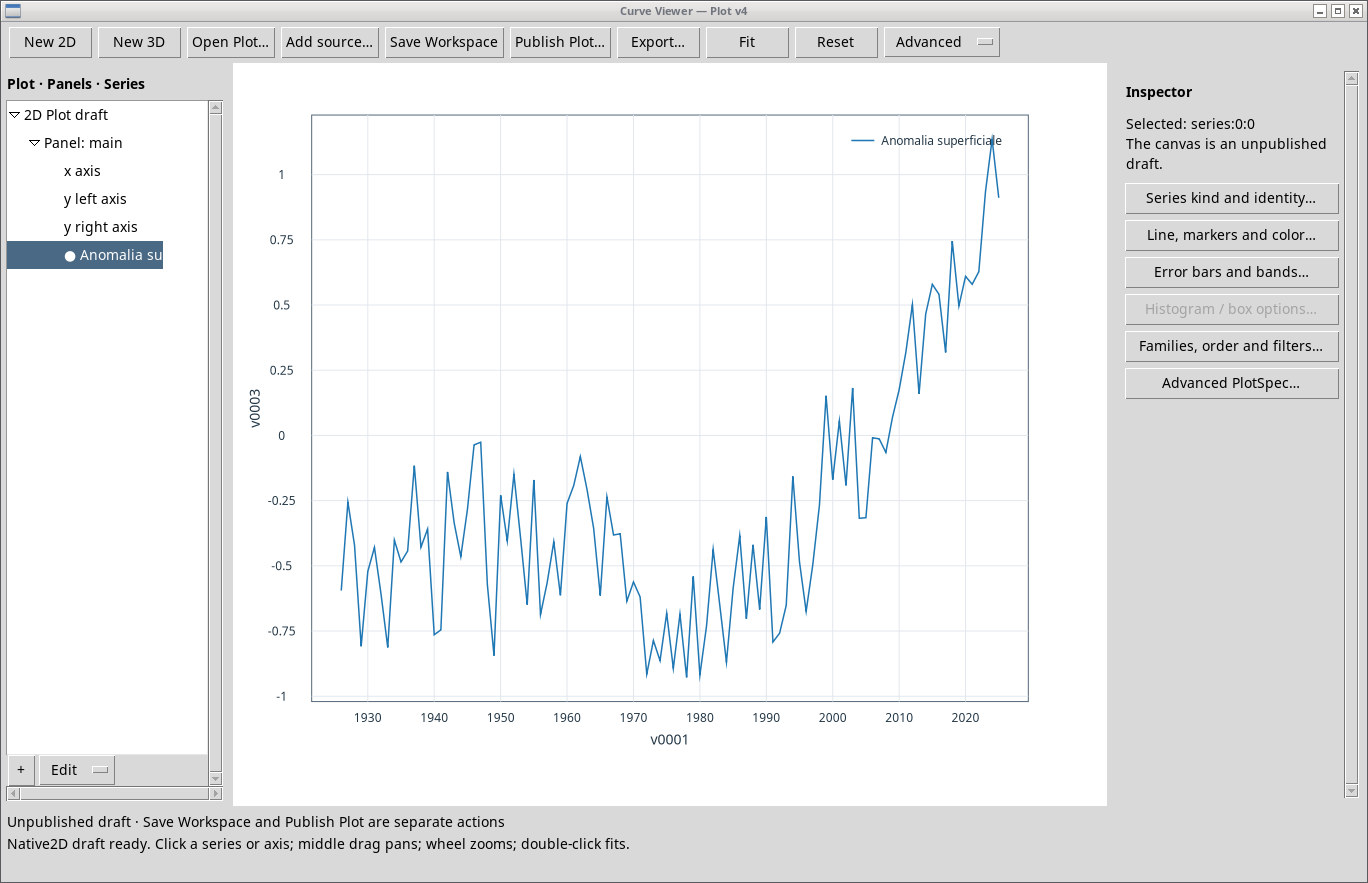
Across the 58 marine cells analyzed, mean sea surface temperature rises from 19.80 °C in the 1926–1935 decade to 21.03 °C in 2016–2025. The difference is about 1.22 °C.
A constant footprint for a hundred years
The NOAA ERSST v5 monthly reconstruction provides sea surface temperatures on a 2° × 2° grid. We selected the cell centers inside the Natural Earth Mediterranean marine polygons, with complete monthly coverage from January 1926 to December 2025. Each cell is weighted in proportion to the cosine of latitude. Months are weighted by their number of days. The resulting mean refers to the selected cells, and narrow coastlines are represented only coarsely. NOAA ERSST v5 · Natural Earth, marine data.
Figure 1
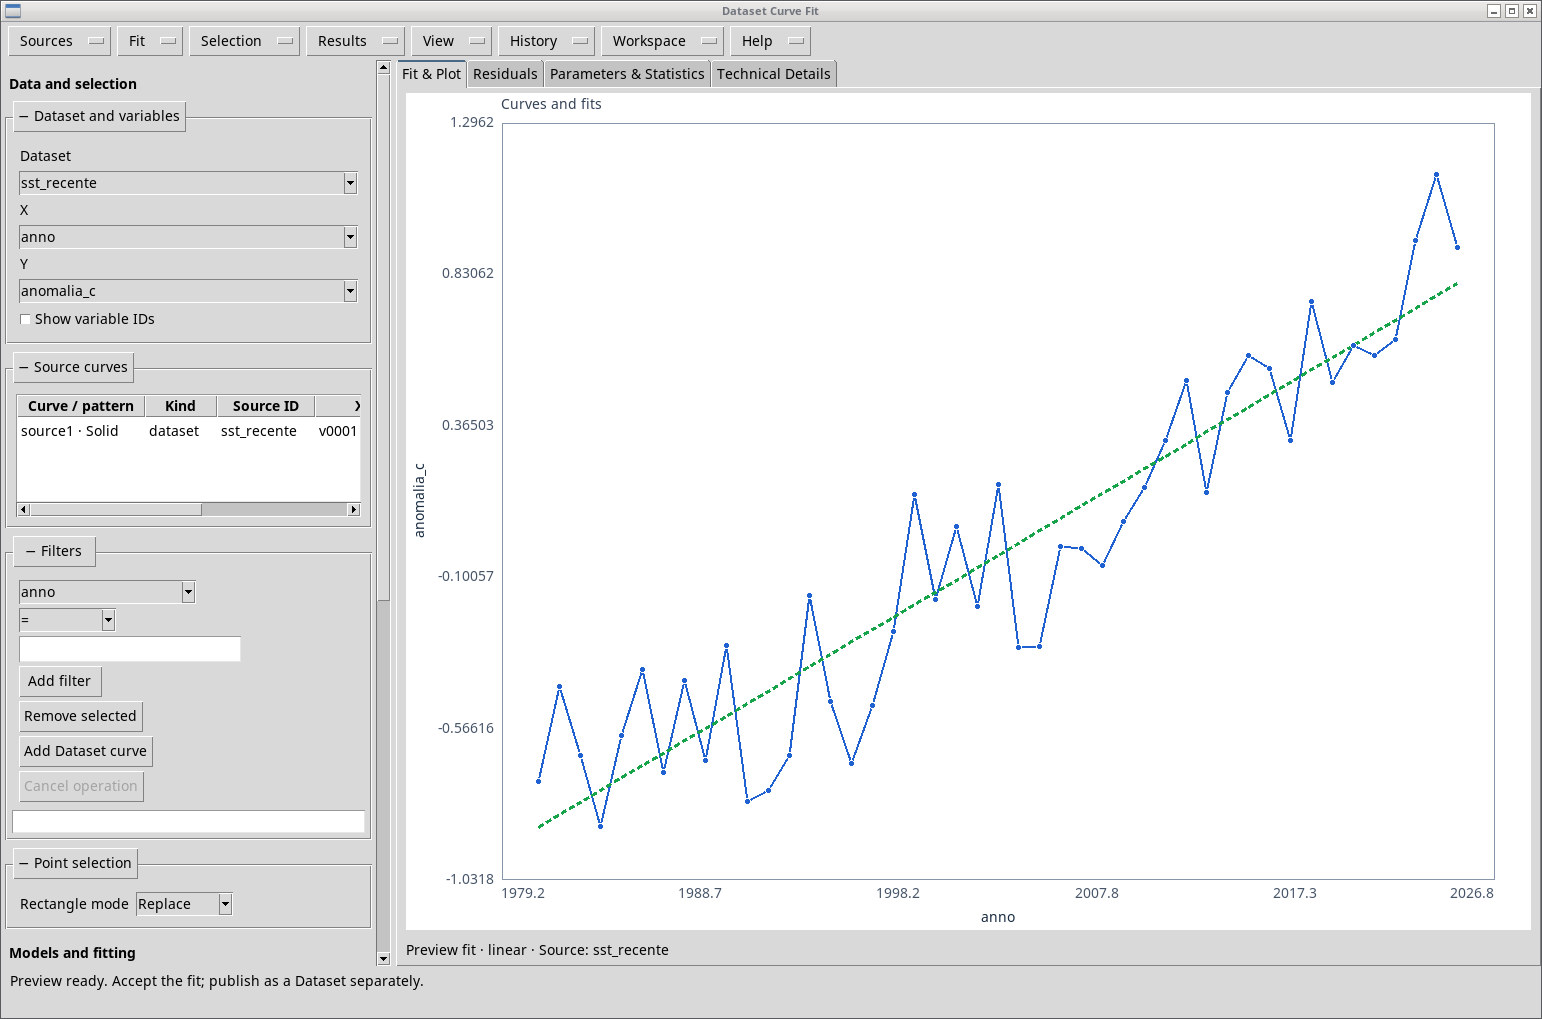
One line for the century and one for the recent period
Curve Fitter returns +0.095 °C per decade over 1926–2025, with 100 points, RMSE 0.370 °C and R² 0.353. Over 1981–2025 the slope is +0.380 °C per decade, with 45 points, RMSE 0.202 °C and R² 0.856. The windows overlap, and the two slopes describe the chosen intervals. A formal test for a change in slope would require a dedicated model and a treatment of autocorrelation.
Figure 2
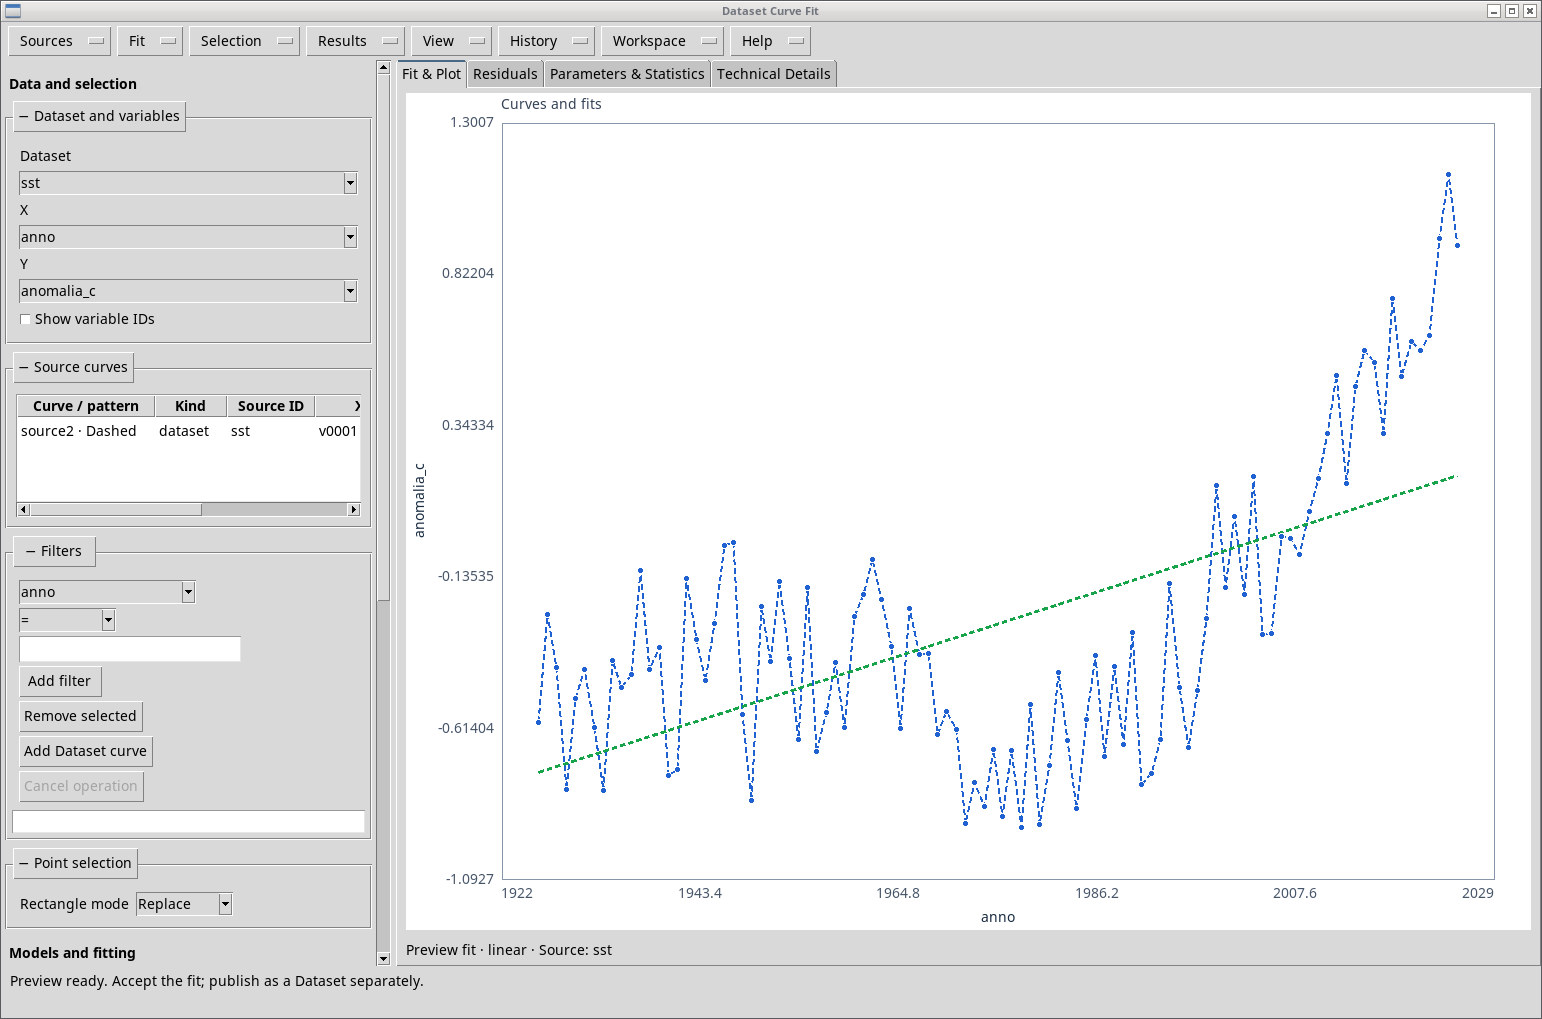
Figure 3
Annual values and historical uncertainty
The 1991–2020 reference mean of the sample is about 20.34 °C. In 2024 the mean is 21.47 °C and in 2025 it is 21.25 °C. A single year cooler than the one before is consistent with a warming trend over several decades. ERSST reconstructs historical data with varying coverage, and the precision of a reported figure must be kept distinct from the uncertainty of the reconstruction. Coastal cells and narrow basins are particularly sensitive to the grid used. Huang et al., description of ERSST v5.
Data to reproduce the analysis
Mediterranean and Climate · Data and Methods · Back to the five-studies project