

Air and Sea: Two Series Compared
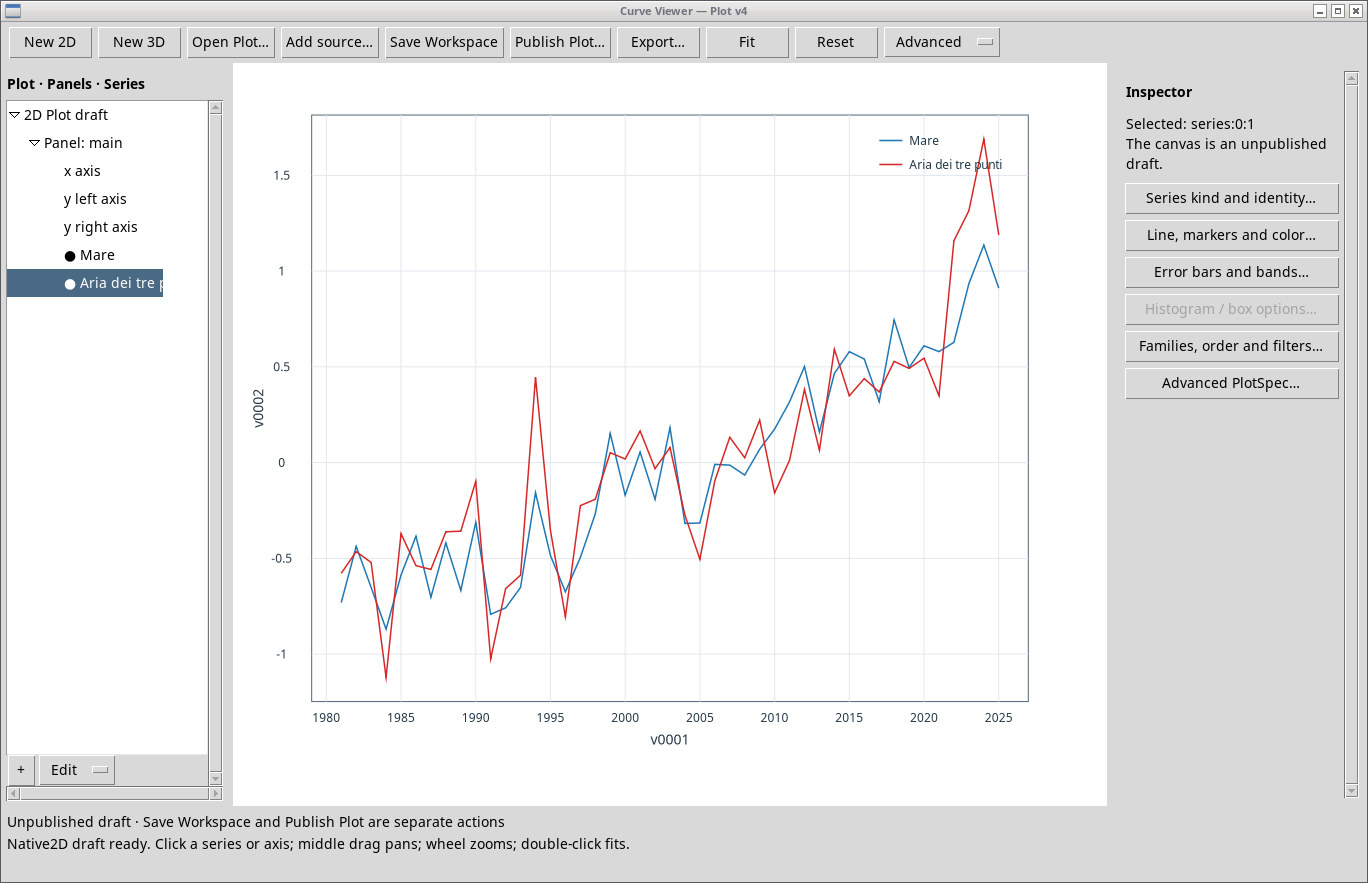
From 1981 to 2025, warmer surface waters tend to coincide with warmer air at the three chosen land points. The association remains visible when comparing year-on-year changes.
Three land points in southern Europe
We used air temperature at 2 meters, T2M, from NASA POWER with MERRA-2 data at the Valencia, Rome and Athens points. For each point we subtracted its 1991–2020 mean and then took a simple average of the three anomalies. The coordinates refer to reanalysis cells, which differ from individual stations and from national averages. The sea uses the ERSST series extracted within the limits described in the article on the surface. NASA POWER, monthly and annual data · NASA, MERRA-2.
Figure 1
Comparing levels and changes
With the sea anomaly on X and the mean air anomaly on Y, Curve Fitter gives a slope of 1.03 °C/°C and R² 0.861 over 45 annual pairs. Both series show an underlying trend. To reduce the influence of this trend we also computed the change in each quantity from the previous year. Over the 44 pairs of changes the fit returns a slope of 1.04 and R² 0.480. The second comparison points to a weaker relationship for year-on-year changes than for level anomalies.
Neither an annual fit nor the differences indicate the direction of a causal effect. Sea and air may respond to the same change in weather and climate conditions. The result is an exploratory study at three land points, to be extended with wider spatial coverage and a model that accounts for seasonality and lags.
Data to reproduce the analysis
Mediterranean and Climate · Data and Methods · Back to the five-studies project