

Air Quality · Data and Methods
Series and criteria
- Aligned daily data with blank cells for missing or excluded measurements.
- Annual means of valid days, 90% coverage threshold.
- Days above 50, valid days and coverage percentage.
- Monthly profile on common days.
- CSV for the Mantua fit.
- Bergamo common days for Grouped Statistics · Report from the GX-TXT module · Download the report (.zip).
- Three ARPA sensor extractions, original values and flags.
Reproducing the figures
Acquire the CSV files with Generic CSV dataset import. In Curve Viewer use anno as X for the annual means and the exceedances, or mese for the profile. Add one curve per station. In Curve Fitter use anno and mantova from the two-column table, the linear, all points and Preview fit.
Median, quartiles and mean in Grouped Statistics
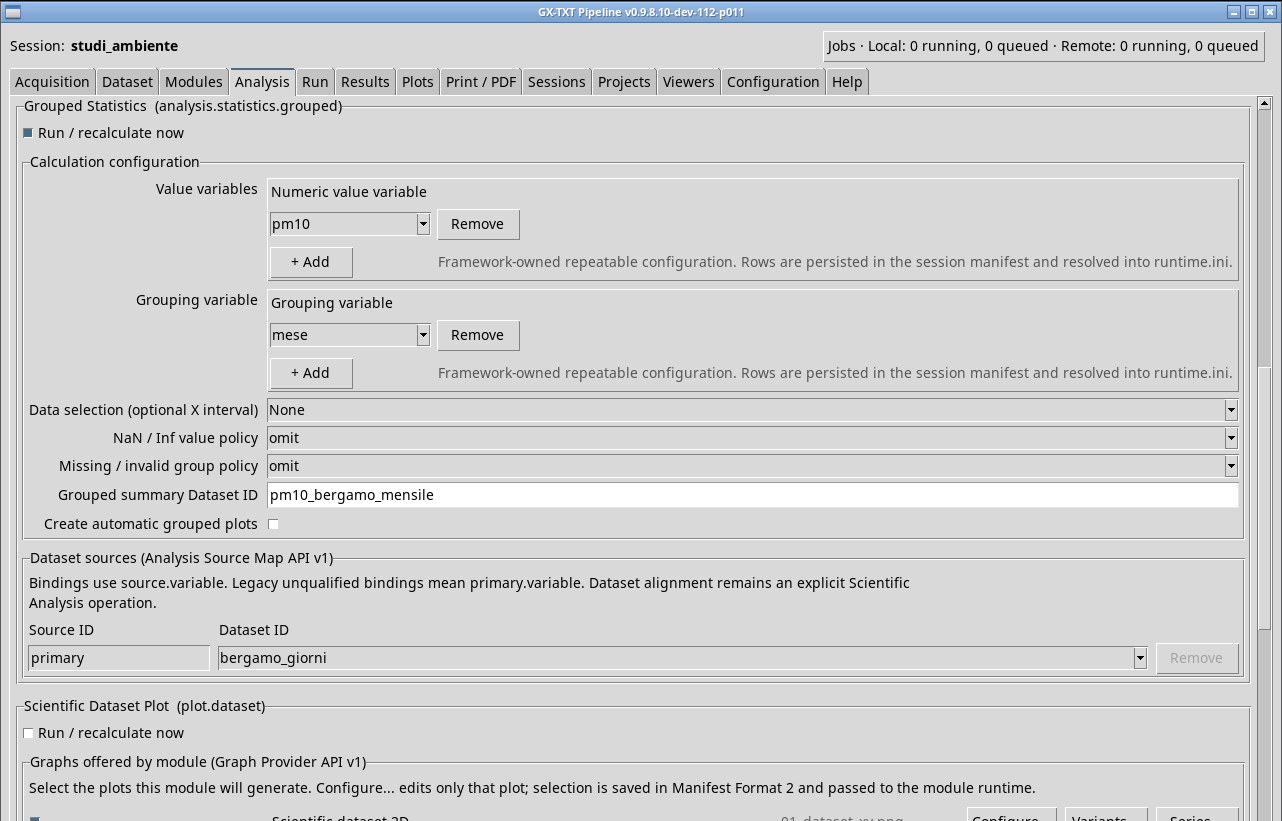
Enable Grouped Statistics in Configuration → Modules → Analysis & Services. In Analysis choose the Dataset of Bergamo common days and a single grouping variable, mese. As the numeric variable choose pm10. Keep all records, turn off the automatic plots and start Run. The report contains 12 groups and shows, for example, 233 values in January and 240 in May. Concentrations are in µg/m³, as documented by the ARPA archive.
Origin and attribution
ARPA Lombardia, measurement archive since 2018 and sensor registry. Sensors 10405 (Bergamo v. Garibaldi), 9831 (Mantova S. Agnese), 6947 (Pavia p.zza Minerva). The archive gives µg/m³ and provides daily means for PM10. Extraction on 22 November 2026, interval from 1 January 2018 inclusive to 1 January 2026 exclusive. CC0 1.0 license declared for the tables. The script aligns the calendar across the three extractions, checks for duplicate dates, keeps only VA and values ≥0, and prepares the summaries. This preparation joins the full calendar to the common days before plotting. The fit was computed in Curve Fitter. ARPA measurements · Sensor registry · Metadata and license.