

Data, PlotSpec and Scientific Plotting
Scientific Python in GX-TXT · Module 6 · Lesson 31
A graph is born from data and choices of representation. The Dataset keeps the variables; a PlotSpec describes which variables to show, in which panel and with which presentation. In this lesson we prepare and validate a spec linked to the synthetic series of the course.
Objectives
- Distinguish data, specification and rendering image.
- Compose Python dictionaries and lists to describe a series.
- Connect the stable dataset identifier chart and variables.
- Validate the specification with
PLOT_DATASET_API_v4.
From Dataset to representation
At the corso_python Session we published corso_python_serie_sintetica, with time_values in seconds and signal in millivolt. The values are synthetic. The PlotSpec does not contain a new measure: it indicates to the program which Dataset reads and how to place the series. The same source can be represented in different ways without changing the original values.
The structure contains a panels list; each panel can contain a series list. A series identifies Dataset, variable X, variable Y, axis and track type. IDs must correspond to those actually present at the Session. The panels[0] position indicates the first panel of the list returned by new_spec.
Execution
In the corso_python Session, import plotspec.py, save it in the Python Script Workspace and start it with Run → Open Script Runner → Run Job.
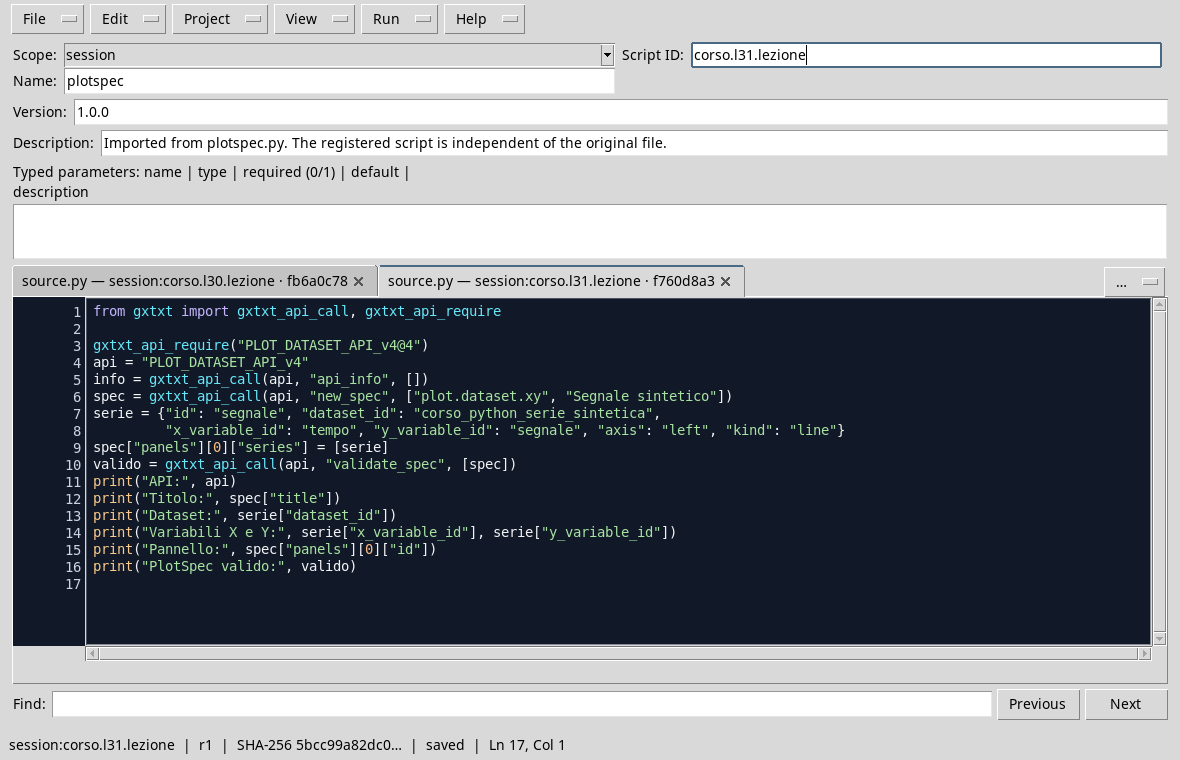
from gxtxt import gxtxt_api_call, gxtxt_api_require

gxtxt_api_require("PLOT_DATASET_API_v4@4")
api = "PLOT_DATASET_API_v4"
info = gxtxt_api_call(api, "api_info", [])
spec = gxtxt_api_call(api, "new_spec", ["plot.dataset.xy", "Synthetic signal"])
series = {"id": "segnale", "dataset_id": "corso_python_serie_sintetica",
         "x_variable_id": "tempo", "y_variable_id": "segnale", "axis": "left", "kind": "line"}
spec["panels"][0]["series"] = [series]
valid = gxtxt_api_call(api, "validate_spec", [spec])
print("API:", api)
print("Titolo:", spec["title"])
print("Dataset:", series["dataset_id"])
print("Variables X and Y:", series["x_variable_id"], series["y_variable_id"])
print("Pannello:", spec["panels"][0]["id"])
print("PlotSpec valid:", valid)
new_spec provides an initial structure for a 2D Cartesian Chart. The series dictionary connects the time_values and signal IDs; the Y axis is the left one. The assignment to the series list inserts the series into the panel. validate_spec checks that the specification is acceptable and that the references used respect the contract. A valid result does not show itself that the scientific choices are appropriate: we need to read the units and verify the meaning of the data.
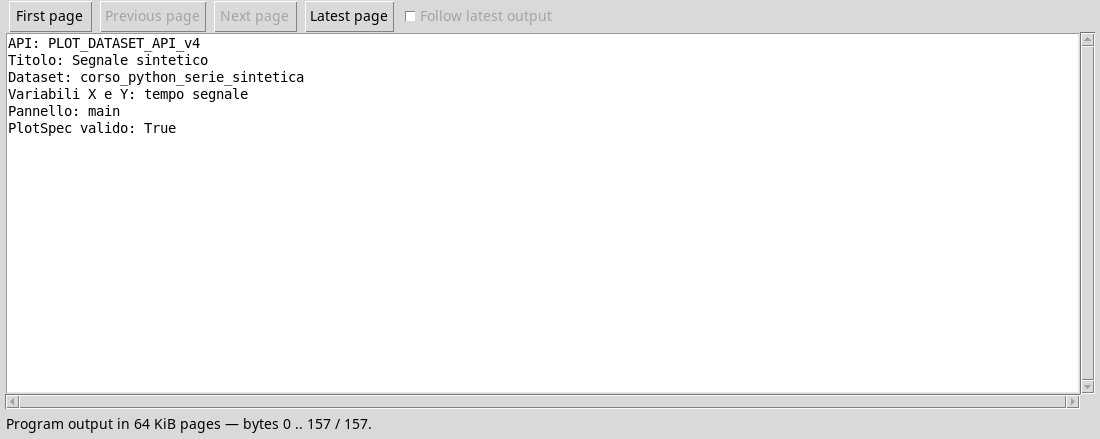
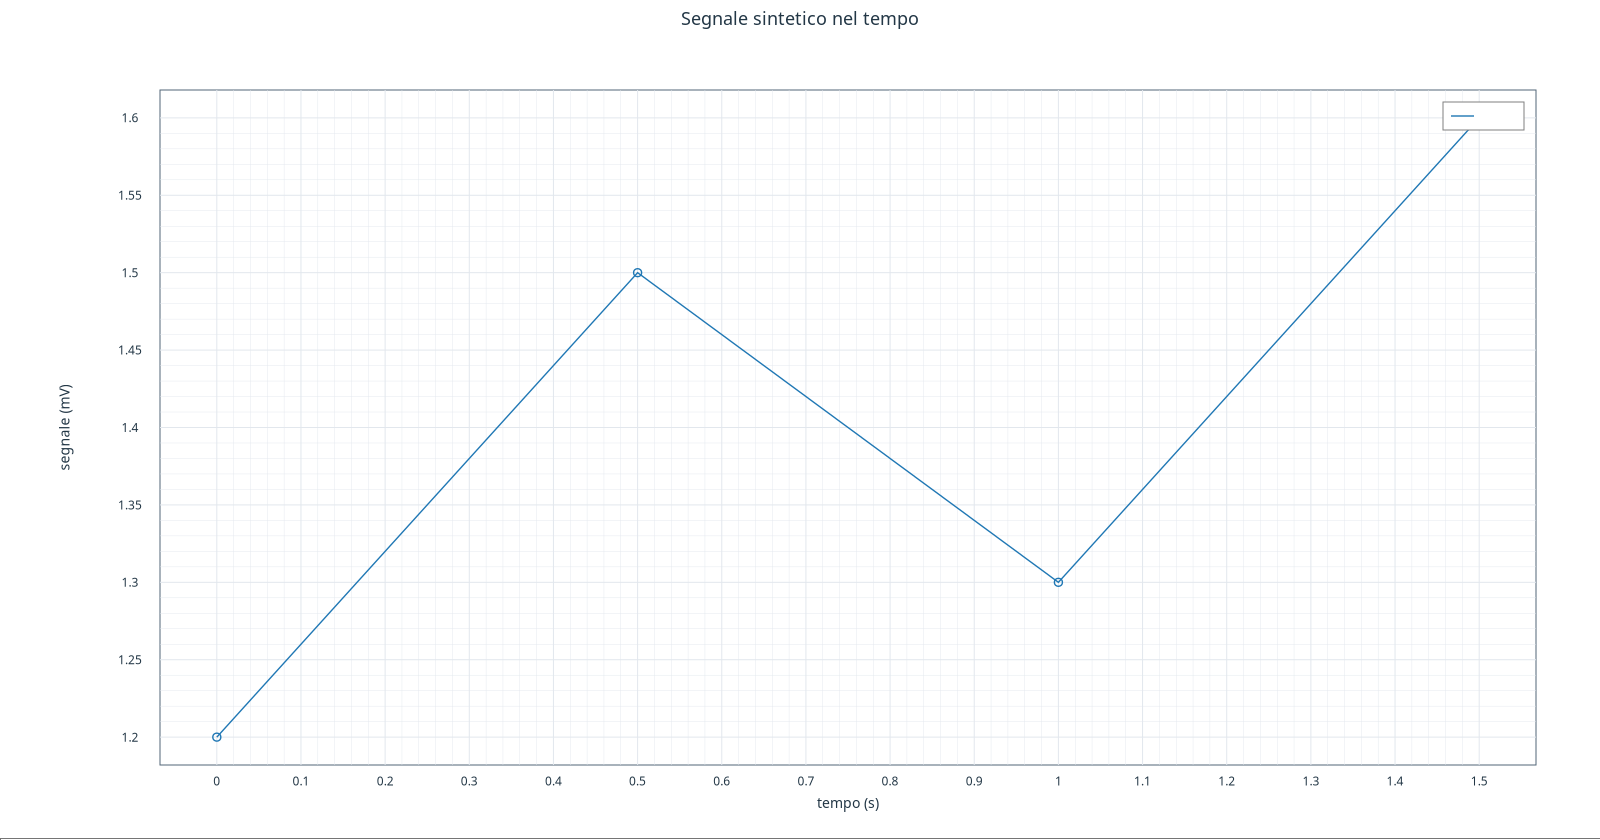
The output shows PlotSpec valid: True. This script prepares and validates the description; the creation and rendering of a persistent variant are the next step. The following figure shows the chart obtained in the next step using the same data.
Exercise
- Which field identifies the variable on the horizontal axis?
- Changing the title of the spec changes the values of the Dataset?
- Why is it useful to validate IDs before creating a chart?
Worked solution
x_variable_id, set here attime_values.- No: the title belongs to the representation, not to the values of the series.
- It allows to detect invalid references or non-compliant structure prior to creation; however, it is necessary to evaluate the scientific suitability of the view.
In the next lesson, we create and visualize the curve.