

Axes, Units, Scales and Titles
Scientific Python in GX-TXT · Module 6 · Lesson 33
The same Dataset can be shown with different limits and titles. A good presentation makes the sizes readable and does not hide the meaning of variations. In this lesson we compare two graphs of the same synthetic series.
Objectives
- Set axle titles and properties with the Plot API.
- Indicate physical units in labels.
- Recognize the effect of limits on the perception of the curve.
- Choose a scale consistent with the data domain.
Practical example
The synthetic series contains times in seconds and signals in millivolt. In the corso_python Session, import axes_and_units.py, save it in the Python Script Workspace and run it from Run → Open Script Runner → Run Job.
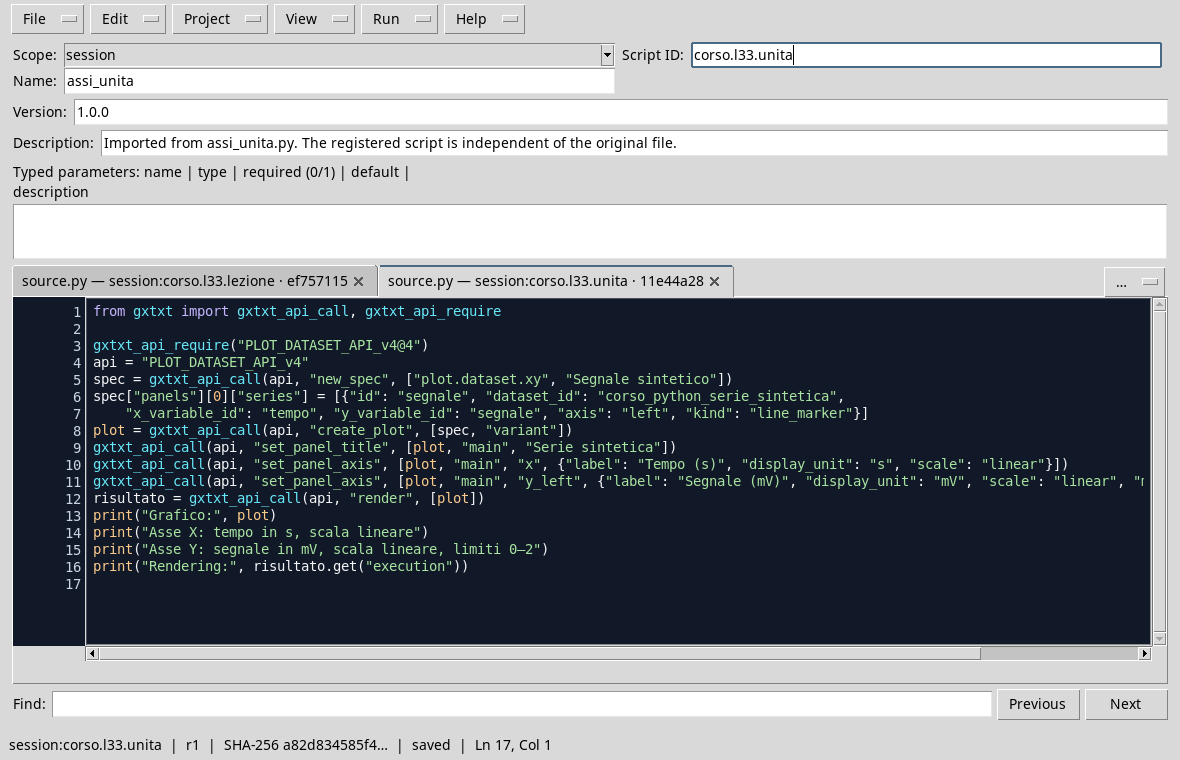
from gxtxt import gxtxt_api_call, gxtxt_api_require

gxtxt_api_require("PLOT_DATASET_API_v4@4")
api = "PLOT_DATASET_API_v4"
spec = gxtxt_api_call(api, "new_spec", ["plot.dataset.xy", "Synthetic signal"])
spec["panels"][0]["series"] = [{"id": "segnale", "dataset_id": "corso_python_serie_sintetica",
    "x_variable_id": "tempo", "y_variable_id": "segnale", "axis": "left", "kind": "line_marker"}]
plot = gxtxt_api_call(api, "create_plot", [spec, "variant"])
gxtxt_api_call(api, "set_panel_title", [plot, "main", "Synthetic"])
gxtxt_api_call(api, "set_panel_axis", [plot, "main", "x", {"label": "Tempo (s)", "display_unit": "s", "scale": "linear"}])
gxtxt_api_call(api, "set_panel_axis", [plot, "main", "y_left", {"label": "Segnale (mV)", "display_unit": "mV", "scale": "linear", "min": 0.0, "max": 2.0}])
result = gxtxt_api_call(api, "render", [plot])
print("Graph:", plot)
print("Axis X: time in s, linear scale")
print("Y axis: signal in mV, linear scale, 0–2 limits")
print("Rendering:", result.get("execution"))
The script creates a variant, assigns a title to the main panel and configures the two axes with set_panel_axis. For X uses seconds, for Y millivolt; both scales are linear. The Y limits are set from 0 to 2 mV. The label is text: when we explicitly choose it we include unity, because it must correspond to the size actually shown. display_unit instead establishes the display unit according to the agreement of the API; change only the label text does not convert the values.
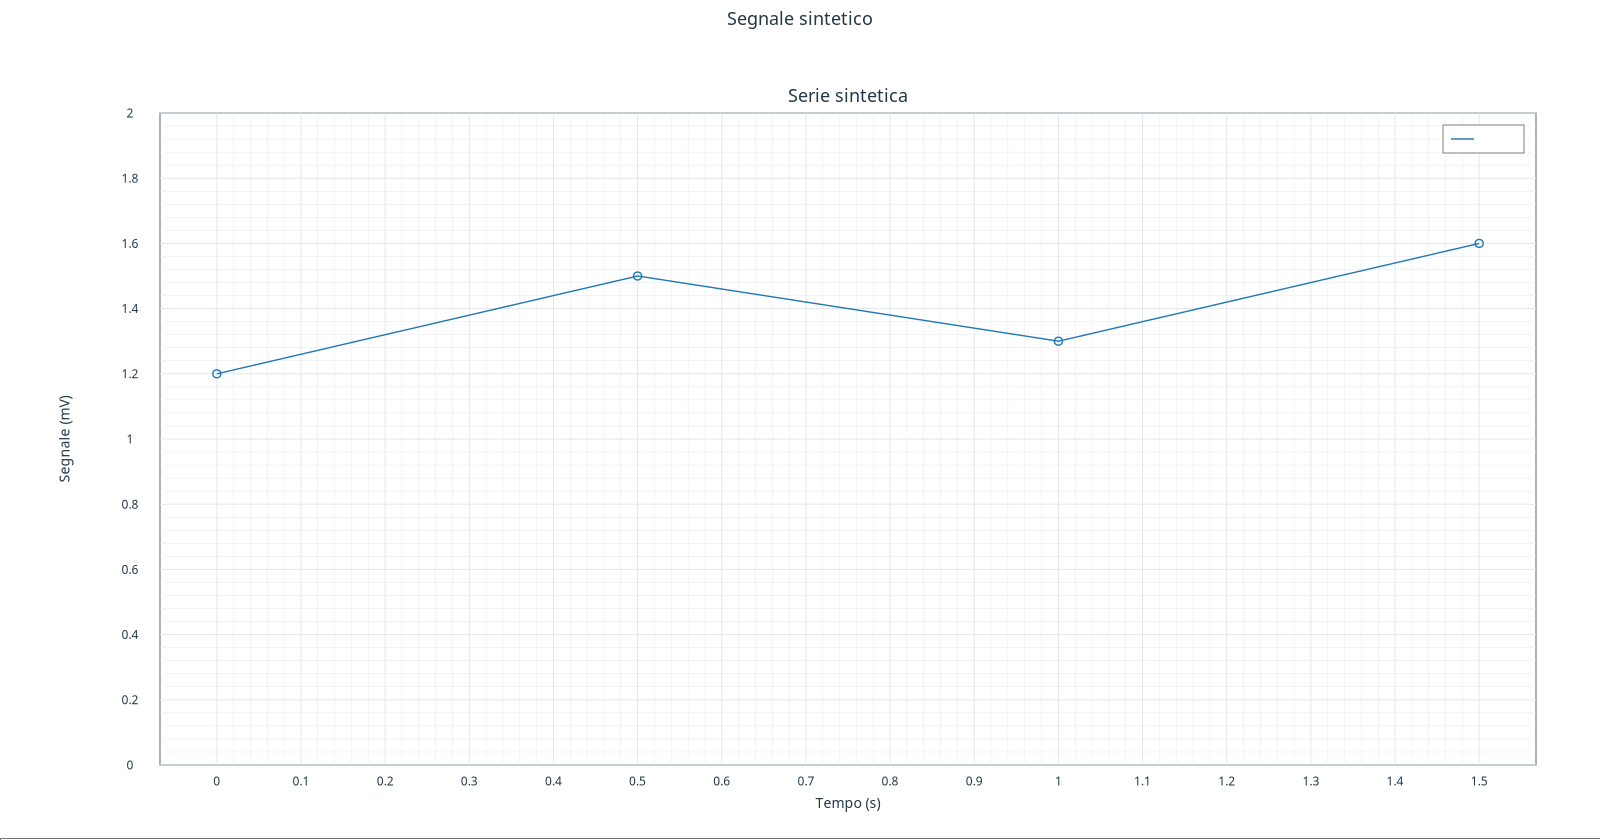
Compare this figure with that of the Lesson 32: the curve comes from the same four points, but there the vertical range adapts more closely to the data. A larger scale makes the variations appear smaller; a narrower scale highlights them. Neither of us changes the data. The choice must be declared and adapted to the question, especially when comparing different figures.
Stairs and units
A linear scale allocates equal distances to equal numerical differences. A logarithmic scale represents relationships: a real logarithmic scale requires positive values in the displayed domain. Zero and negative numbers are not allowed on a normal logarithmic axis. Before choosing a scale, check data, limits and units; do not change units by writing only another label.
When it compares two signals, it uses compatible units and consistent limits for the purpose. If the variable is in mV and you want to display it in V, a correct conversion changes the displayed values of a factor 1000: 1 mV = 0,001 V. The unit shown must follow the actual conversion.
Exercise
- How much is the signal worth at
1 s? How does the data change if the Y axis is extended up to 2 mV? - Does
label: "Segnale (V)"automatically convert data to mV? - Is it appropriate to include zero in a logarithmic axis?
Worked solution
1,3 mV; the data does not change, it only changes its position in the representation.- No. The label is text; it serves an effective and consistent conversion.
- No: the zero logarithm is not defined. You need to choose a compatible scale and domain.
In the next lesson we will discuss more serious and work on their visual identification.