Magnetics Example: Boulder Measurements
Use USGS Boulder samples to compute the geomagnetic field magnitude from X, Y, and Z and compare it with the scalar F reported in the data.
Geomagnetic field in XYZF format
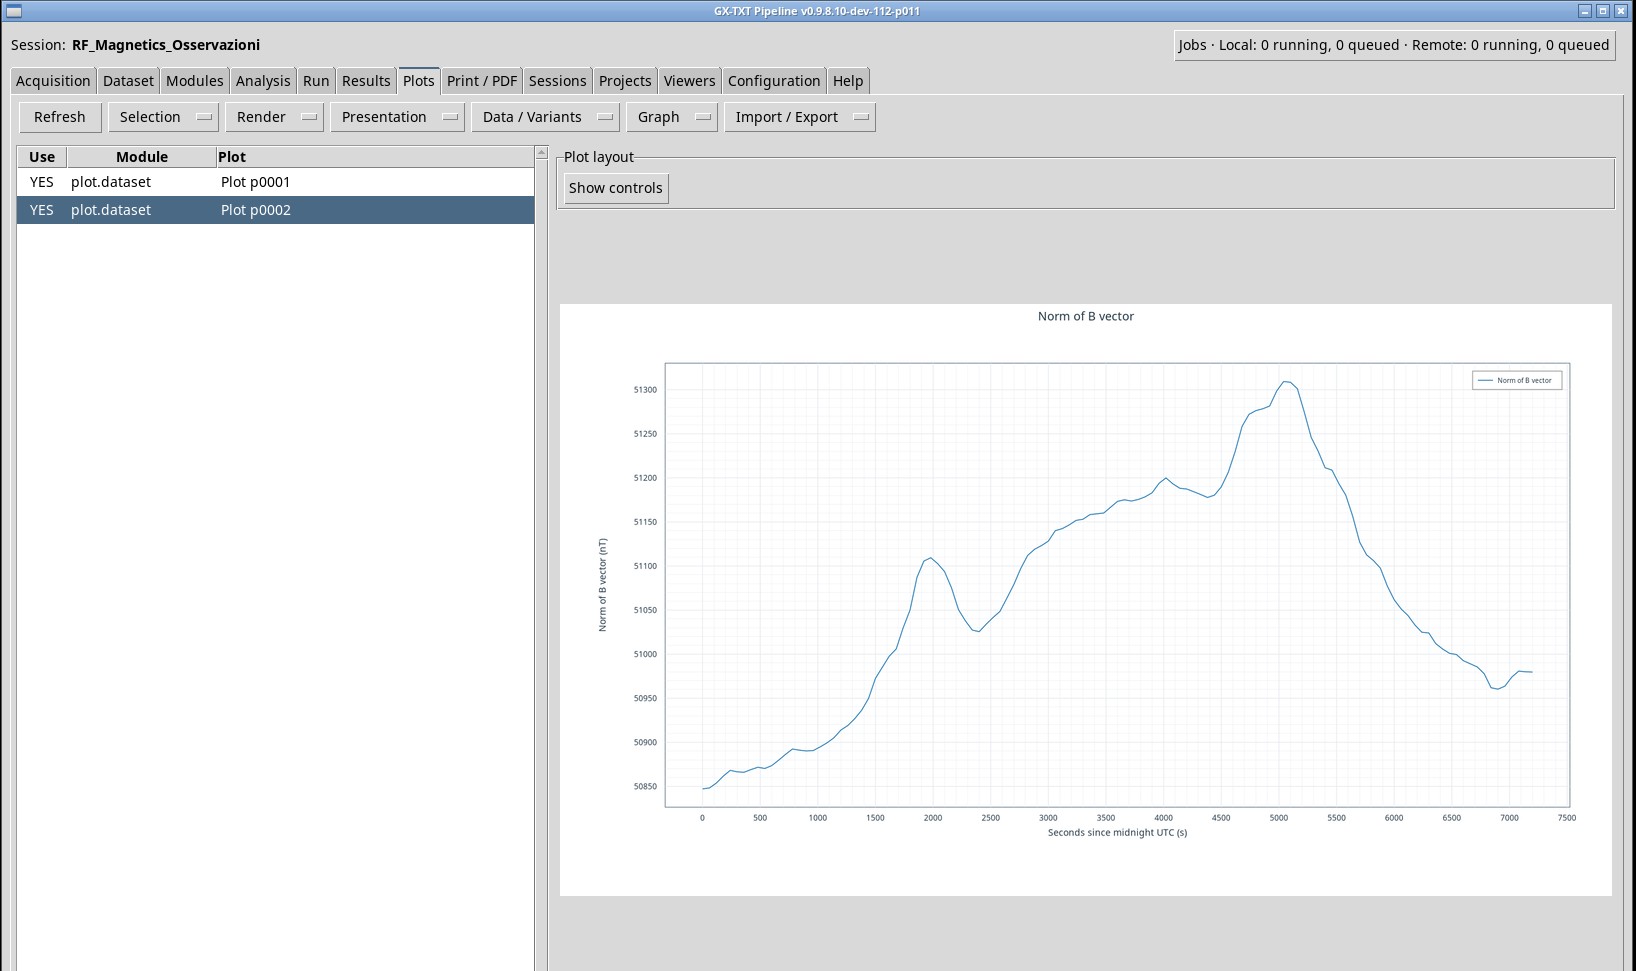
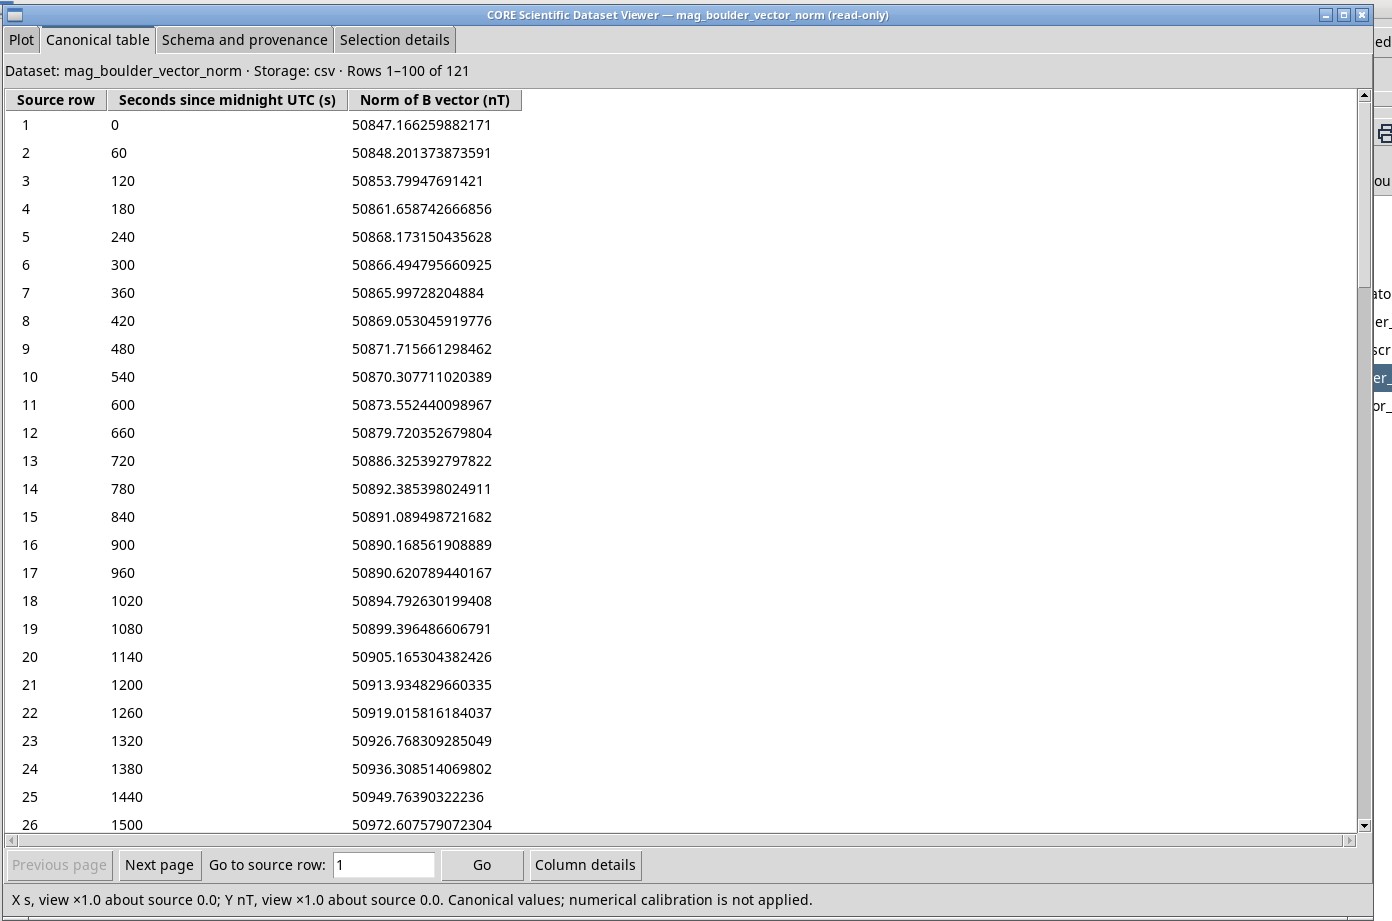
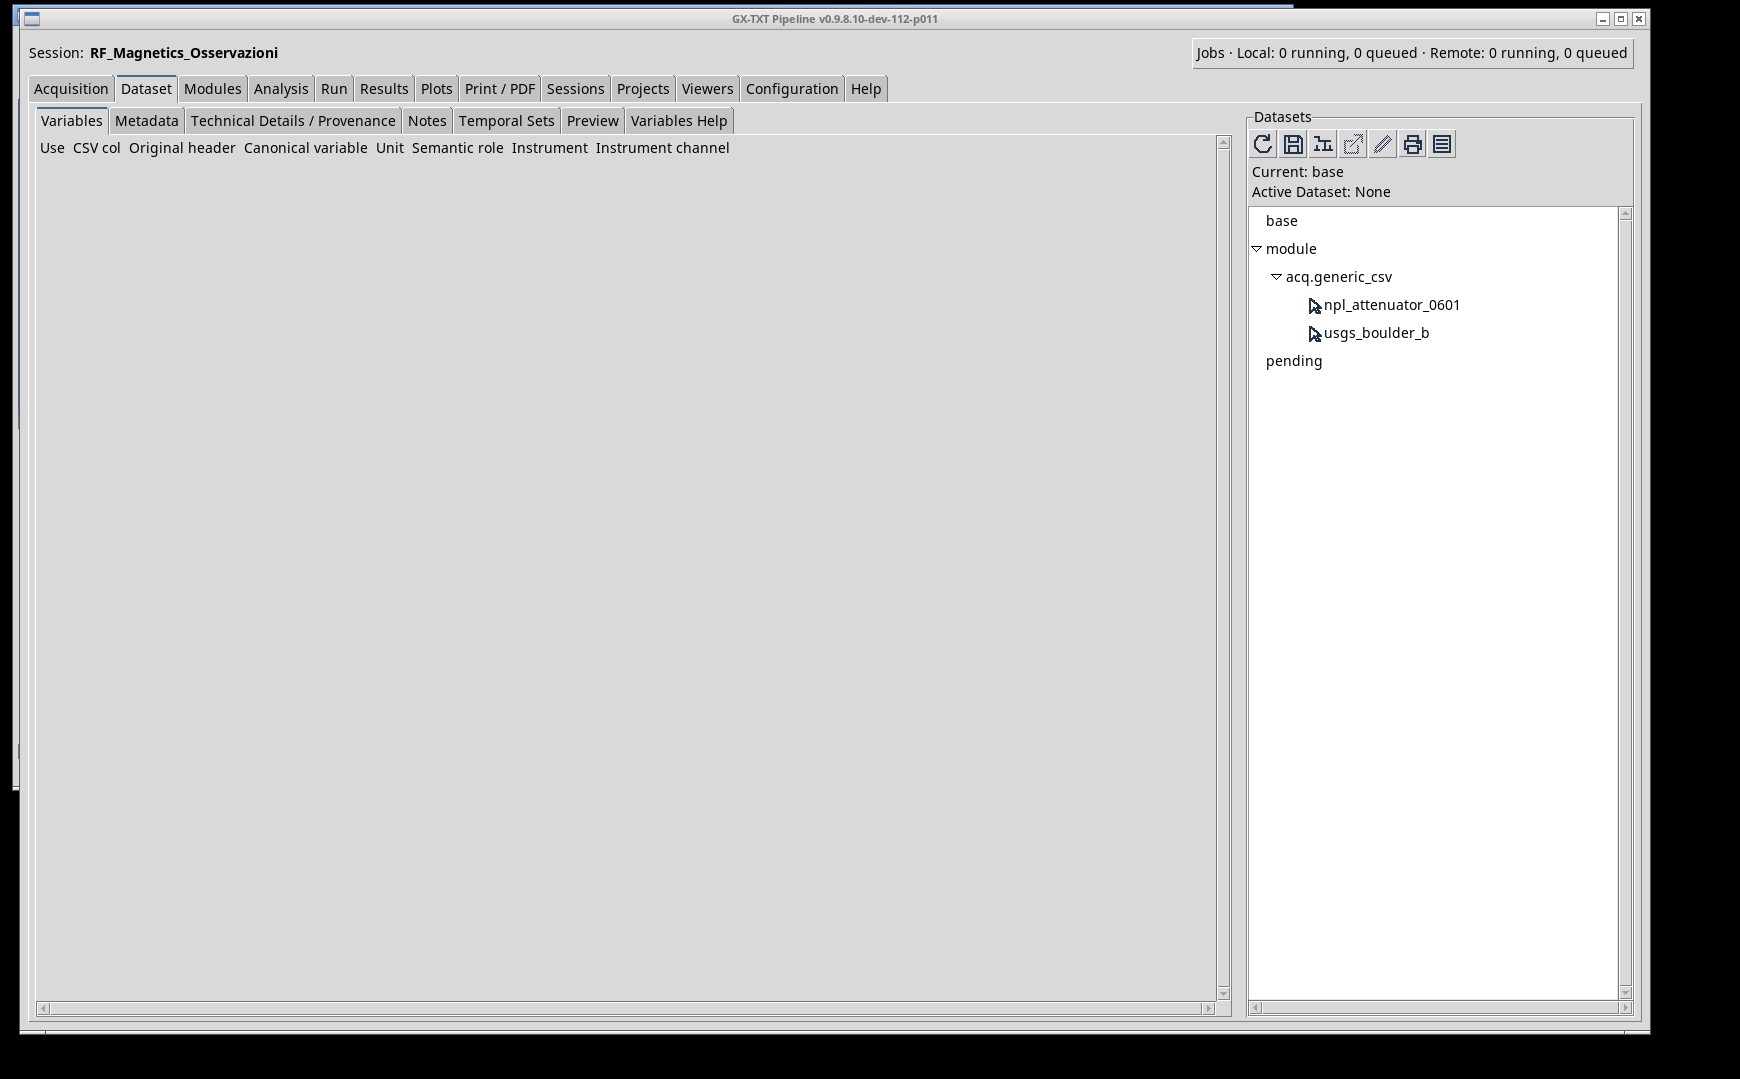
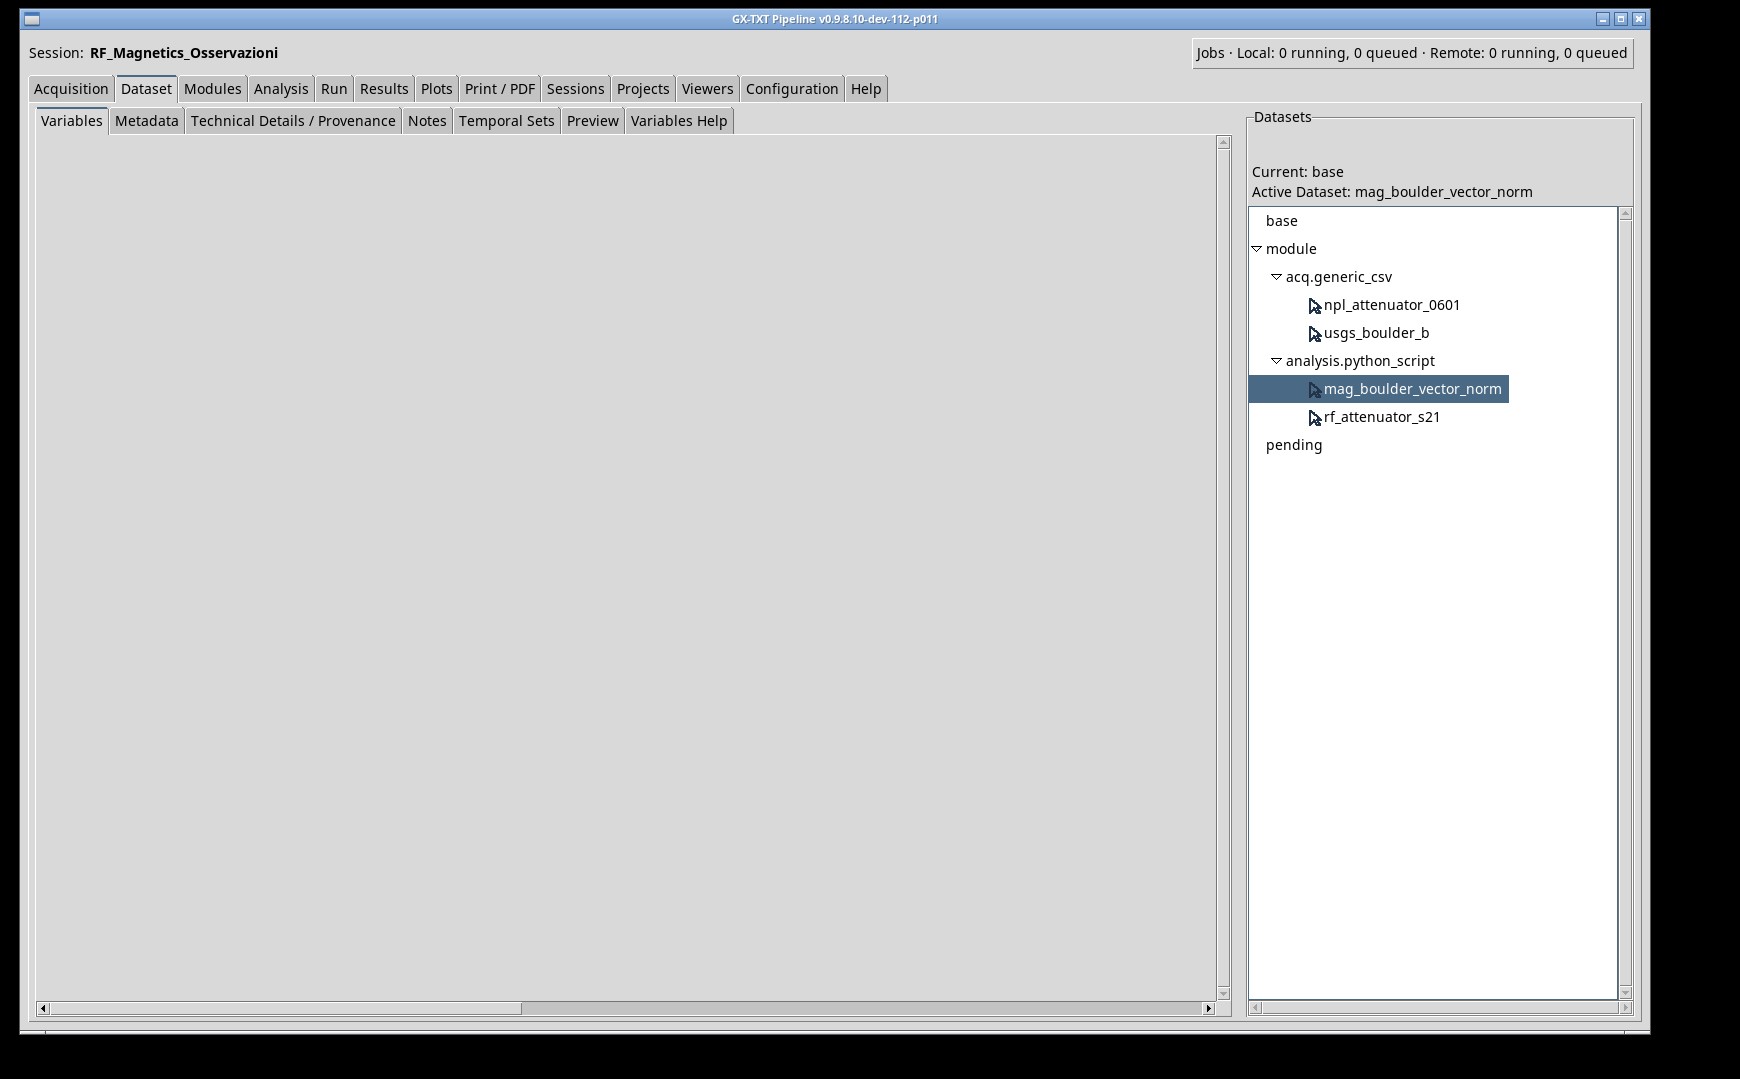
Import boulder_20240511.csv with ID usgs_boulder_b. Use seconds since midnight UTC for time and nT for X, Y, Z, and F. The script computes the vector magnitude with field.magnitude and compares it with the NumPy norm. F is reported as a separate scalar. It provides a physical comparison with its own definition. To run the complete script, also import the RF CSV listed in the attenuator chapter. This excerpt of the provisional IAGA-2002 data contains 121 rows from 00:00 to 02:00 UTC on May 11, 2024. In the first row, the XYZ norm is 50,847.1663 nT and the reported F is 51,364.83 nT.
Data and scripts
- NPL 3 dB attenuator 0601, 201 VNA points · Source
SHA-256057548315a30141a9ee374aa2f0f2c8d330c2fd6ad9ef940dd2a057d8134387c - Original attenuator S2P, CC BY 4.0 (ZIP) · Source
SHA-256c6c7f183cc2fe3d6d3e7594ee54a2b643a82fcfedf604e9ed3429c37bdef1f11 - USGS Boulder, provisional XYZF, 121 samples · Source
SHA-256af81065ed23e9795d784ed8d35d8dfbe37f0d2963360128ce7de65a995c16d48 - job_cancel.py (ZIP)
- job_failure.py (ZIP)
- rf_magnetics_cases.py (ZIP)
- rf_magnetics_publication.py (ZIP)
RF data: Liam Ausden, Nick Ridler, Andrej Rumiantsev, Jon Martens, and Xiaobang Shang, archive 10.5281/zenodo.22658069. The CSV contains the first 201 points of the file calibrated by multiline TRL. Boulder data: U.S. Geological Survey, BOU observatory, via the Web Service for Geomagnetism Data. The CSV retains the original field values and expresses time as seconds since midnight UTC. The source file also refers to the INTERMAGNET data conditions. NPL CC BY 4.0 license · USGS credits · INTERMAGNET data conditions