RF Example: Measured NPL Attenuator
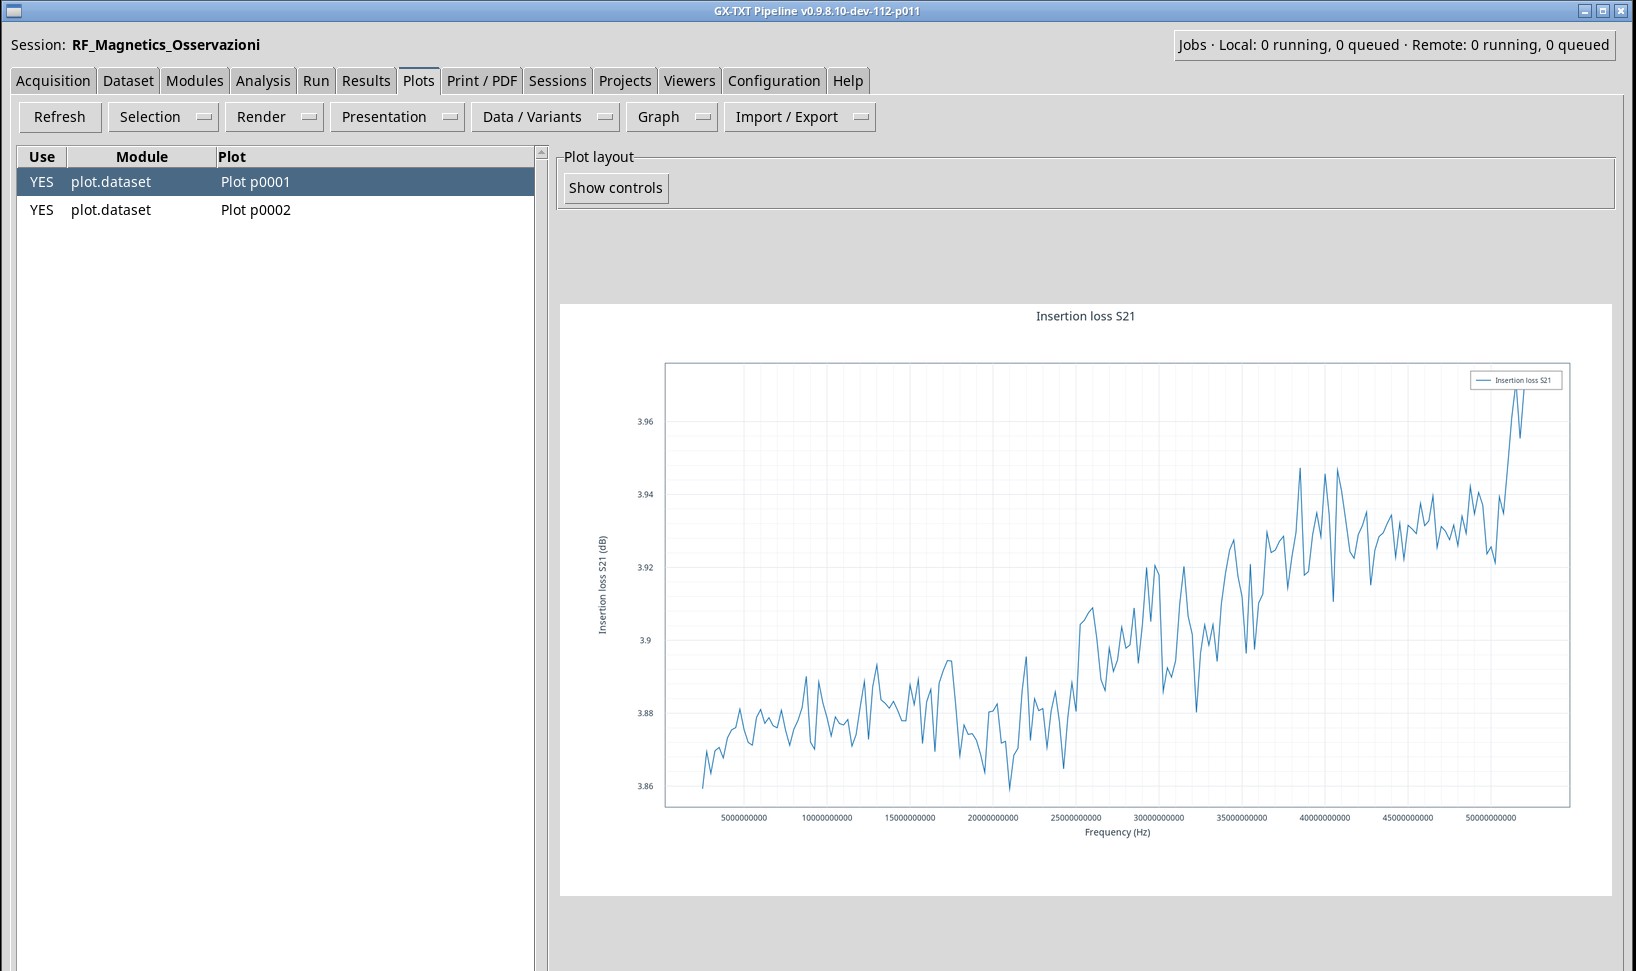
Calculate insertion loss from 201 VNA measurement points for the NPL attenuator, then inspect the results in the Session. Download the data and scripts.
Attenuator 0601 measured with a VNA
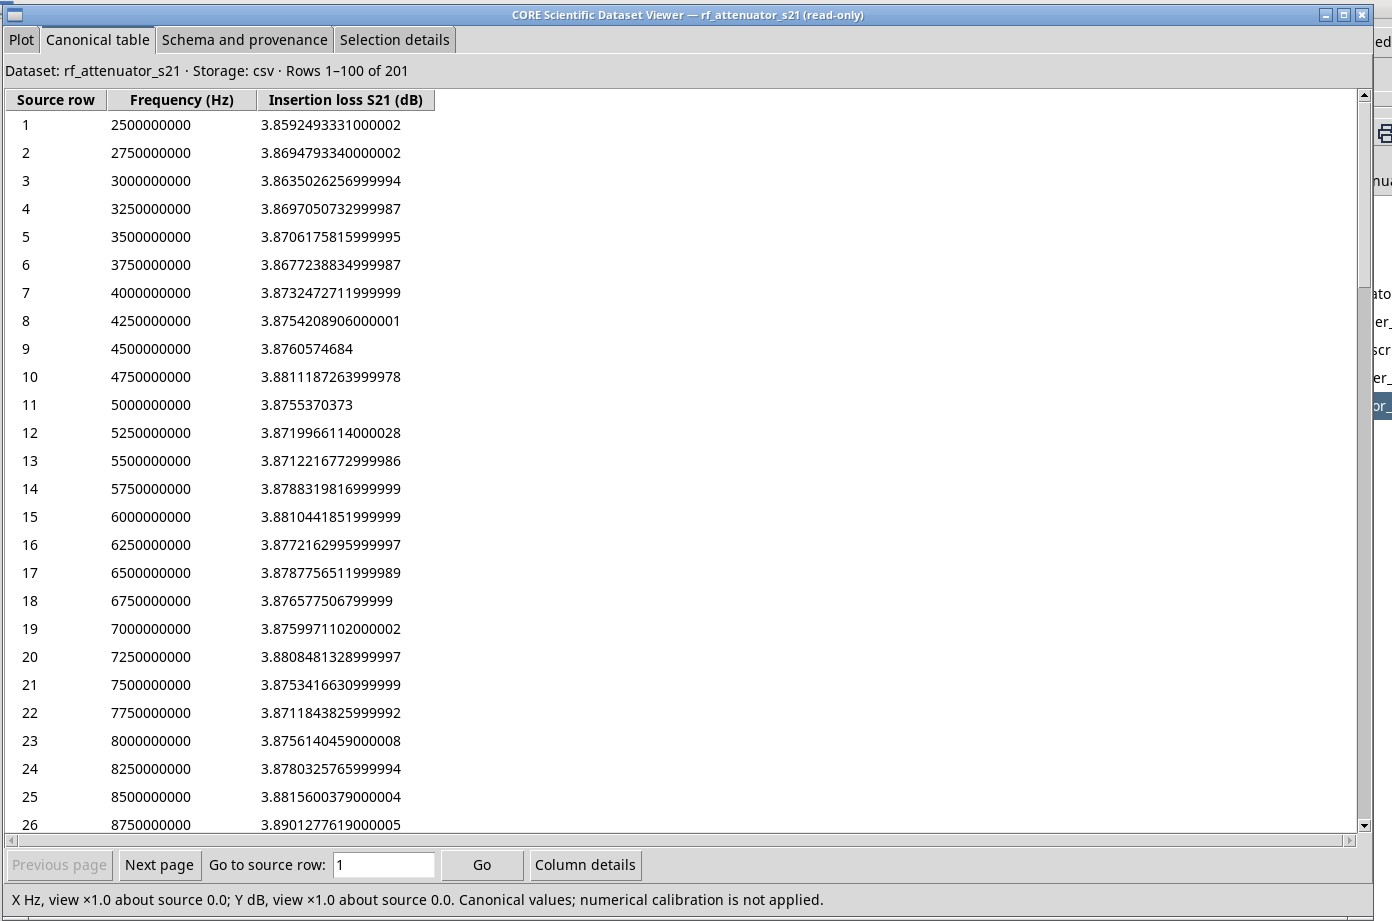
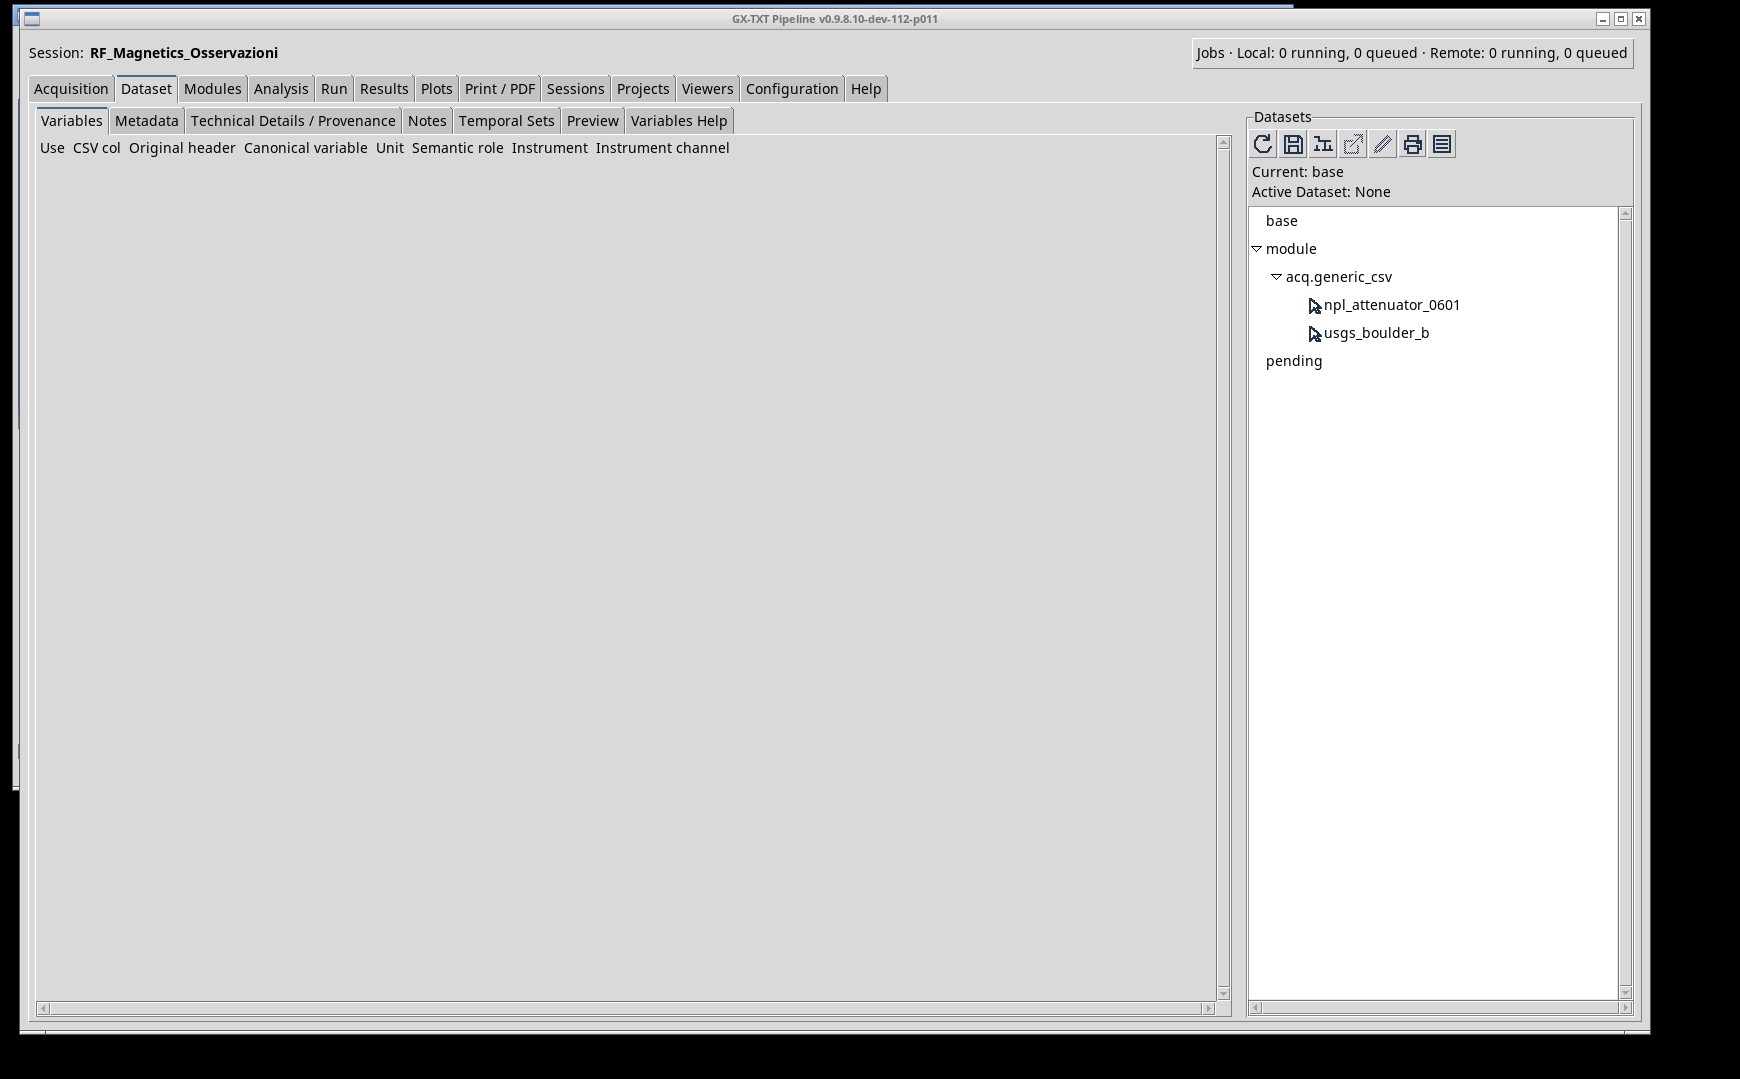
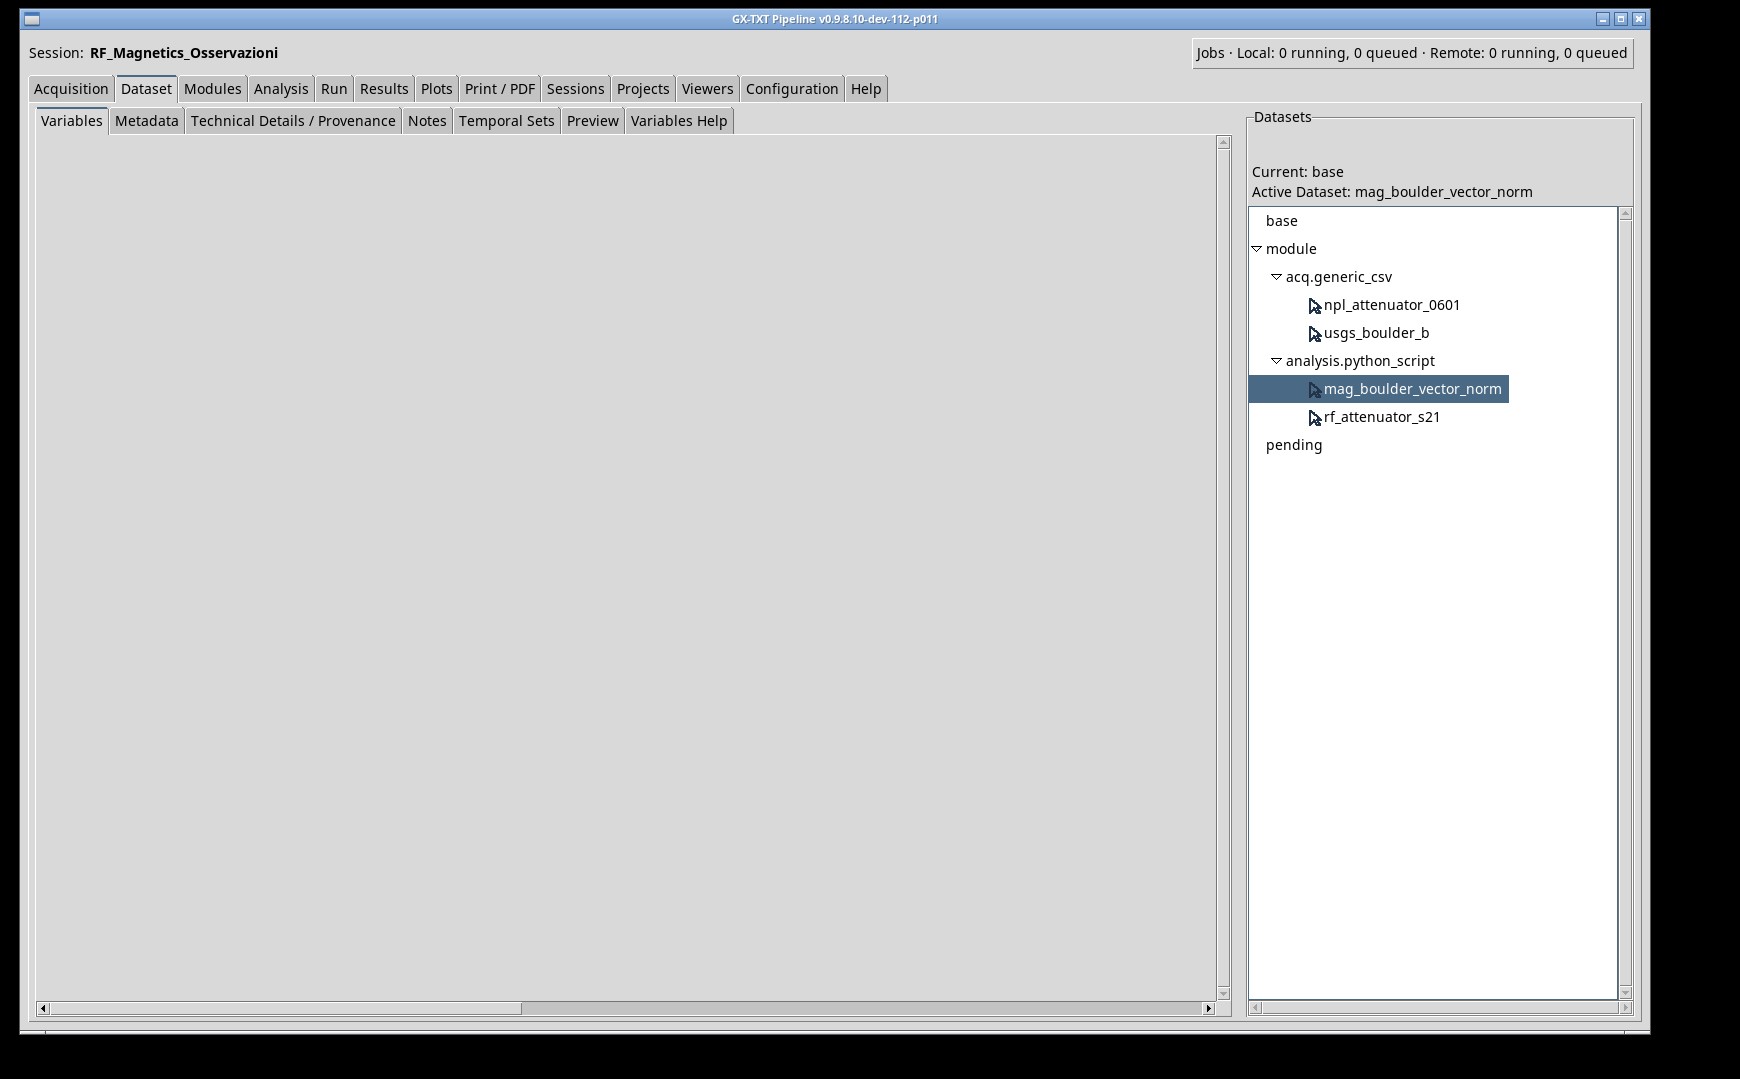
Import npl_attenuator_excerpt.csv with ID npl_attenuator_0601. The first column is in Hz. The other eight are dimensionless components in Touchstone order. The source S2P file declares # Hz S RI R 50.0. The rf_magnetics_publication.py script reconstructs the matrix and checks the insertion loss against −20 log₁₀ |S21|. The Job also includes the Boulder example. Before running the script, import both CSV files with the IDs specified in their respective chapters. The RF subset contains 201 frequencies from 2.5 to 52.5 GHz. Insertion loss is 3.859249 dB at the first frequency and 3.969749 dB at the last.
Data and scripts
- NPL 3 dB attenuator 0601, 201 VNA points · Source
SHA-256057548315a30141a9ee374aa2f0f2c8d330c2fd6ad9ef940dd2a057d8134387c - Original attenuator S2P, CC BY 4.0 (ZIP) · Source
SHA-256c6c7f183cc2fe3d6d3e7594ee54a2b643a82fcfedf604e9ed3429c37bdef1f11 - USGS Boulder, provisional XYZF, 121 samples · Source
SHA-256af81065ed23e9795d784ed8d35d8dfbe37f0d2963360128ce7de65a995c16d48 - job_cancel.py (ZIP)
- job_failure.py (ZIP)
- rf_magnetics_cases.py (ZIP)
- rf_magnetics_publication.py (ZIP)
RF data: Liam Ausden, Nick Ridler, Andrej Rumiantsev, Jon Martens, and Xiaobang Shang, archive 10.5281/zenodo.22658069. The CSV contains the first 201 points of the file calibrated by multiline TRL. Boulder data: U.S. Geological Survey, BOU observatory, via the Web Service for Geomagnetism Data. The CSV retains the original field values and expresses time as seconds since midnight UTC. The source file also refers to the INTERMAGNET data conditions. NPL CC BY 4.0 license · USGS credits · INTERMAGNET data conditions