

Annotations and Plot Presentation
Scientific Python in GX-TXT · Module 6 · Lesson 36
An annotation helps the reader to locate a significant point or region. It must add context without changing data or suggesting unsupported conclusions. In this lesson we note a value of the synthetic series using the PlotSpec.
Objectives
- Insert a text annotation into a panel.
- Recognize coordinates and annotation units.
- Distinguish Dataset, specific, chart and screenshot.
- Prepare a figure with consistent title and caption.
A known point
The synthetic series of the course is 1,5 mV to 0,5 s. We add near that point the text “Synthetic value: 1.5 mV”. The text describes an already present value: it does not add a sample and does not imply that it is a real measure.
In the corso_python Session, import annotations.py, save the script and start it with Run → Open Script Runner → Run Job.
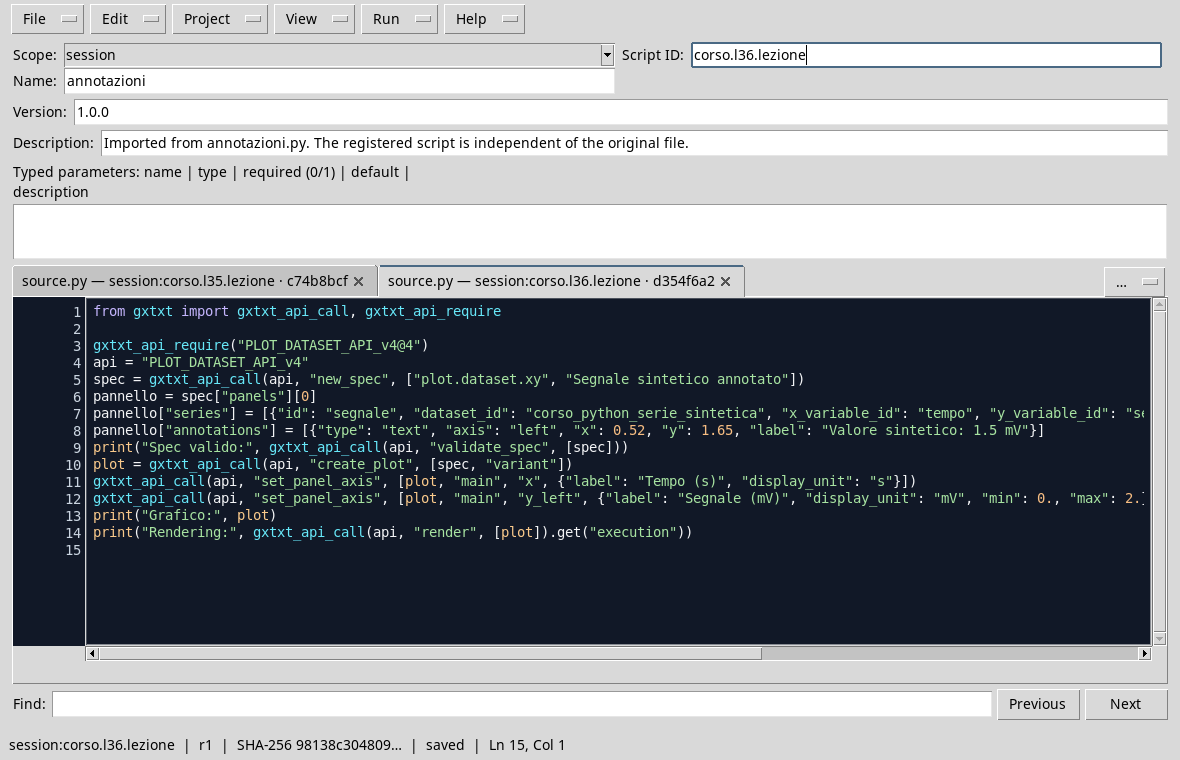
from gxtxt import gxtxt_api_call, gxtxt_api_require

gxtxt_api_require("PLOT_DATASET_API_v4@4")
api = "PLOT_DATASET_API_v4"
spec = gxtxt_api_call(api, "new_spec", ["plot.dataset.xy", "Synthetic signal noted"])
panel = spec["panels"][0]
panel["series"] = [{"id": "segnale", "dataset_id": "corso_python_serie_sintetica", "x_variable_id": "tempo", "y_variable_id": "segnale", "axis": "left", "kind": "line_marker", "label": "Synthetic"}]
panel["annotations"] = [{"type": "text", "axis": "left", "x": 0.52, "y": 1.65, "label": "Synthetic value: 1.5 mV"}]
print("Expenditure valid:", gxtxt_api_call(api, "validate_spec", [spec]))
plot = gxtxt_api_call(api, "create_plot", [spec, "variant"])
gxtxt_api_call(api, "set_panel_axis", [plot, "main", "x", {"label": "Tempo (s)", "display_unit": "s"}])
gxtxt_api_call(api, "set_panel_axis", [plot, "main", "y_left", {"label": "Segnale (mV)", "display_unit": "mV", "min": 0., "max": 2.}])
print("Graph:", plot)
print("Rendering:", gxtxt_api_call(api, "render", [plot]).get("execution"))
The annotations list belongs to the panel. The dictionary defines type: text, the vertical axis left, the coordinates x and y and the string label. The coordinates place the text slightly above the point, so as not to cover the line. The value shown in the label is verifiable in the series; the coordinates of the text are a choice of layout and do not constitute a new data.
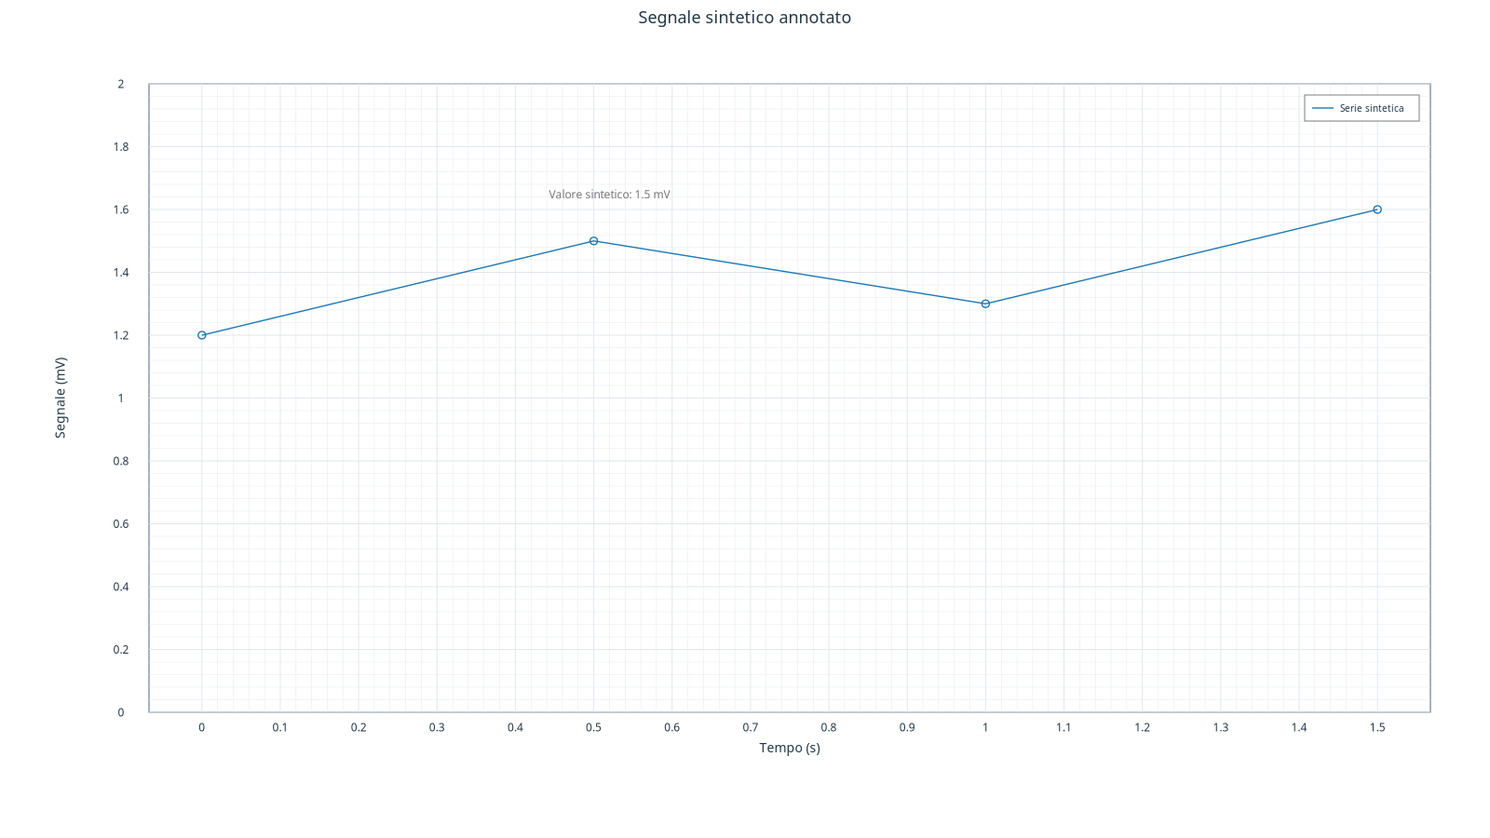
The screenshot is a capture of the GX-TXT graphics window, cut out to show the figure without the external background. The rendering comes from the PlotSpec and the Dataset; the capture is a figure for the guide. A crop must not erase scientifically relevant elements or add new ones. Store also the source files and reference to the Dataset helps to reconstruct the figure.
GX-TXT also offers a separate annotation API for overlays: its coordinate system and its life cycle should be read in the respective contract. The example of this lesson instead uses the annotation of the panel in the PlotSpec, with coordinates of the data representation.
Exercise
- What is the value noted and at what time does it belong to?
- Changing the text position changes the Dataset?
- Why is it useful to include “synthetic” in the title or label?
Worked solution
1,5 mVto0,5 s.- No: you change the presentation, not the value of the source variable.
- It distinguishes a data built for the exercise by an experimental measure.
In the next module we will connect parameters, Sessions and transformations to build repeatable analyses.