Worksheet formulas
Write formulas with references and typed values, set the calculation mode, and interpret errors and spilled results.
Build a formula
A formula begins with =. Use the decimal point, parentheses for grouping, quotes for text and field names, the comma between arguments and the colon for a range. Arithmetic and comparison operators are allowed. The formula language is a data grammar separate from the Python editor. Write =B1-$A$1, =B2>2, =numeric.mean(B1:B16) or =Sheet1!A1+B1.
- A1, $A$1, A$1, $A1
- The first reference changes in both directions when copying and filling. The second keeps row and column fixed. The
$sign in front of only the row or the column fixes just that part. - Pick cell/range reference
- With the cursor in the formula, enable the picker, then click a cell or drag across the grid. The highlighted reference is inserted into the formula text. The address of the formula remains the starting one. Turn off the picking mode when you want to go back to navigating.
- Ctrl+Space
- Completes the prefix under the cursor if the match is unique. With several candidates, read the status line and keep typing. You can complete function names, ranges, named columns and sheets.
- Insert formula
- In Functions select the item and press Insert formula. The cell editor opens with the name and the opening parenthesis. Complete the arguments, close the parenthesis and press Apply. Check the mode indicated in the function guide before using it in a cell.
Use scalars, vectors, matrices and records
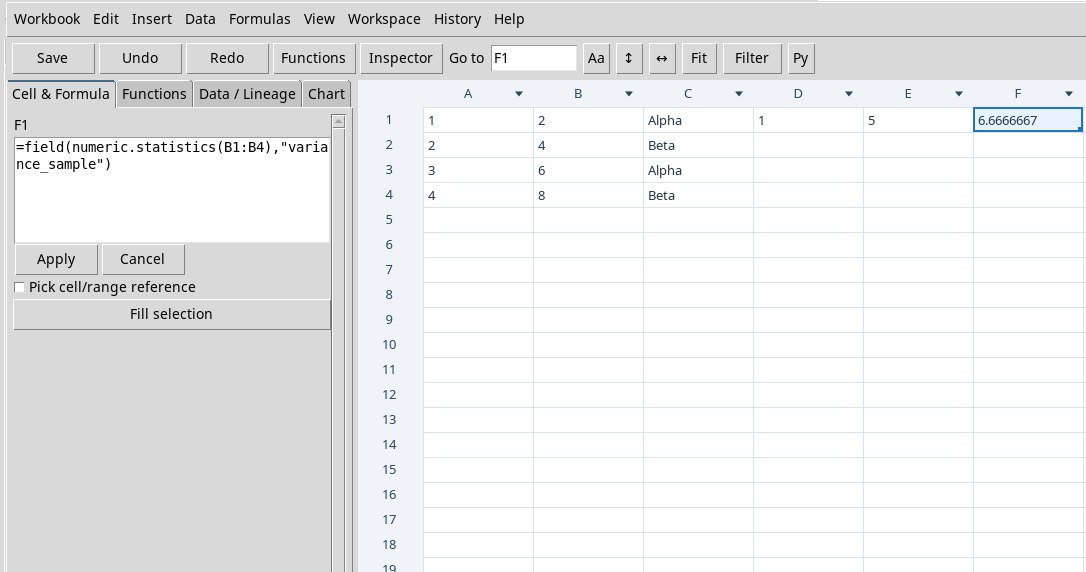
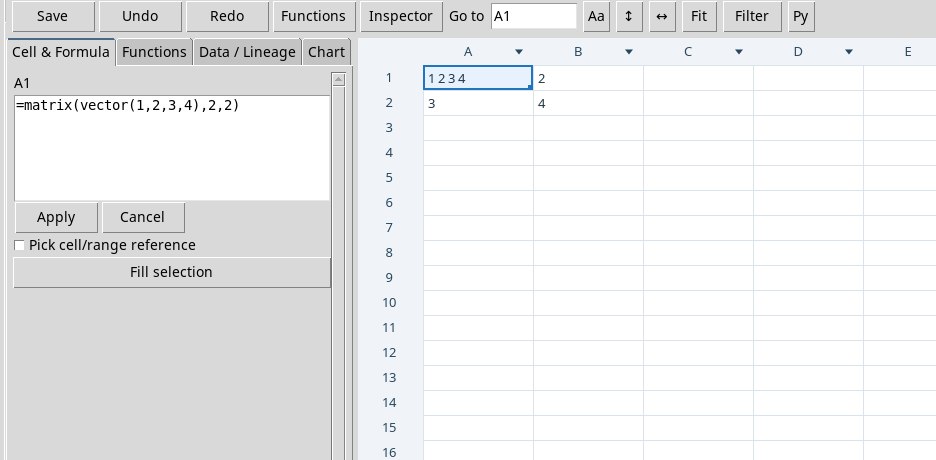
=vector(10,20,30) starts from the active cell and occupies three rows. =matrix(vector(1,2,3,4),2,2) requires a free 2 × 2 rectangle. complex(reale,immaginario) builds a complex number. empty() provides an empty operand. record("datum",7) builds a structured operand. field reads a field from a public result of the provider. A local record created with record does not expose those result fields. For a structured statistic, try =field(numeric.statistics(B1:B16),"variance_sample").
A scalar occupies one cell. The other cells of a vector or matrix derive from the origin of the calculation. Free the area before applying. An occupied rectangle causes #SPILL!. Paste or fill after checking that source and destination do not overlap.
Interpret calculations, types and units
On the bound Dataset =numeric.mean(B1:B16) returns 2 V and the sample variance about 0.5333 V². The sample result uses the denominator n − 1. The variance of the observed population uses n and equals 0.5 V². The standard deviation is back in V. Use Data / Lineage to distinguish the final value, units, statistics and inputs.
For an aggregation over several cells, check the unit of the whole range. For example, a mean that mixes seconds and volts fails. Compatible operations can use the unit registry conversions. The syntax of operations and the result fields depend on the provider. Use the calculation catalog to choose family, form and mode.
Switch between automatic and manual calculation
Formulas → Automatic / manual mode switches the mode. In automatic mode, changes update the formulas. In manual mode the cached results remain until you press Recalculate Workbook or F9. To try it, write 2 in A10 and =A10*3 in B10. Switch to manual and replace A10 with 5. B10 stays at 6 until the recalculation, then shows 15.
Recognize errors and limits
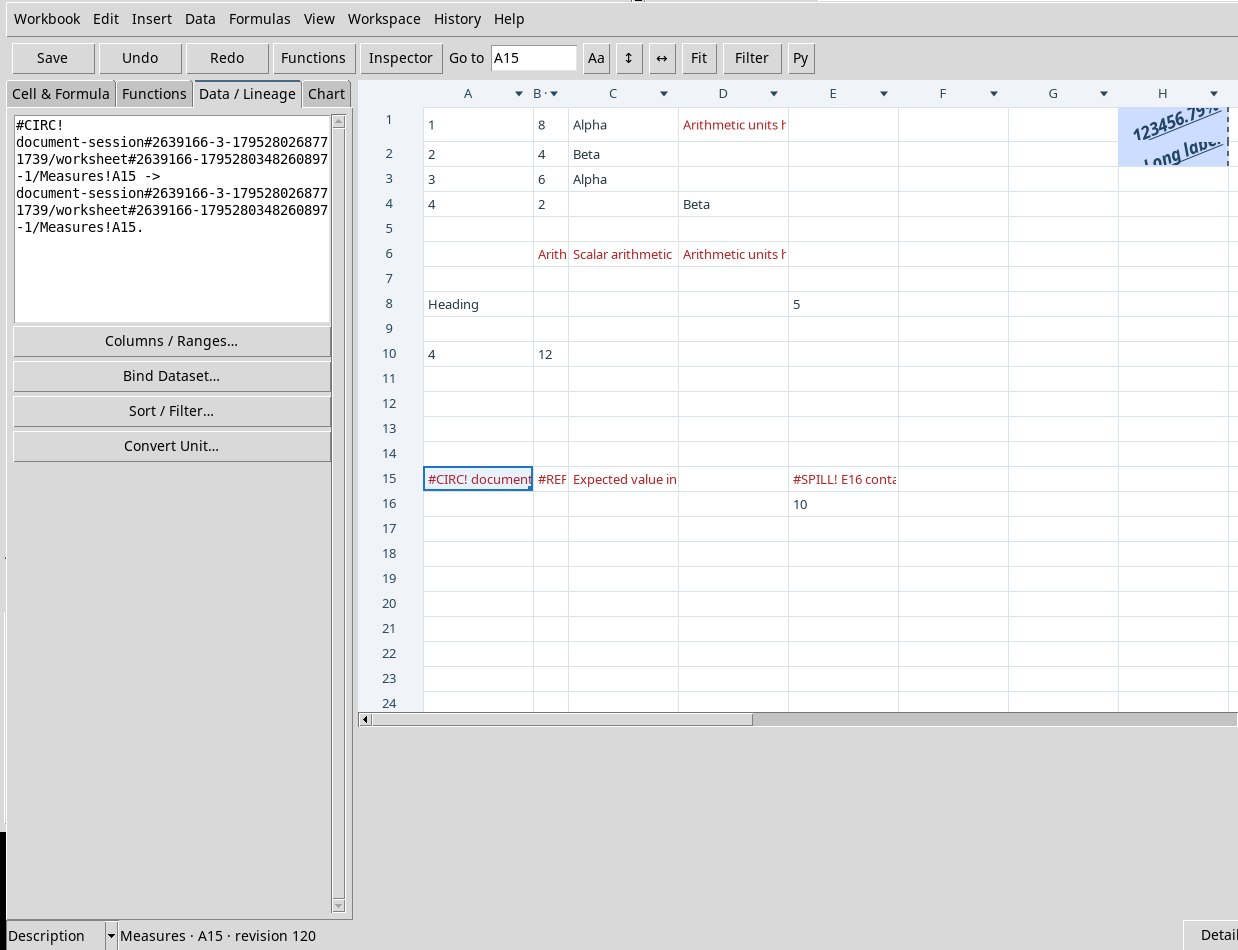
- #CIRC and #REF!
- A cycle, for example
=E2+1in E2, or a missing reference. Check the address and the sheet, or break the circular dependency. - #UNIT and #VALUE!
- Incompatible units, an input of the wrong type, a function not usable in a cell or arguments outside the contract. Consult the function card and Data / Lineage.
- #SPILL!
- The result would occupy cells that are already filled. Select a free destination or reduce the authorized output. The occupied cells remain available.
- Syntax errors
- Check parentheses, separators and names. The formula can still be consulted in the editor. Empty value, missing, NaN, error and text are distinct types.
A formula can have at most 8,192 characters. Formula ranges and guided outputs are limited to 20,000 cells, the statistical summary of the selection to 5,000 and native viewport reading to 4,096. Some statistical vectors captured before saving are limited to 8,192 rows.