

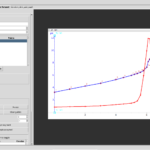
GX-TXT Curve Digitalizer: From a Titration Curve to the Equivalence Point with Python
Written by Giux |
Published on Nov 14, 2026 |
No comments
How can an acid–base titration graph become reproducible scientific data? In this final GX-TXT Curve Digitalizer tutorial, we digitize 35 points from a citric acid titration, publish a scientific Dataset, and use Python to estimate an apparent equivalence volume near 6.1 mL. We also create two native dual-Y-axis plots comparing the original and smoothed pH curves with their numerical derivative.