Open the Session that contains your canonical numeric Datasets in GX-TXT. If the data are not registered yet, import or publish them through the component that normally owns them.
In Viewers, open Curve Viewer. Choose New 2D for an X/Y plot or New 3D for X/Y/Z data.
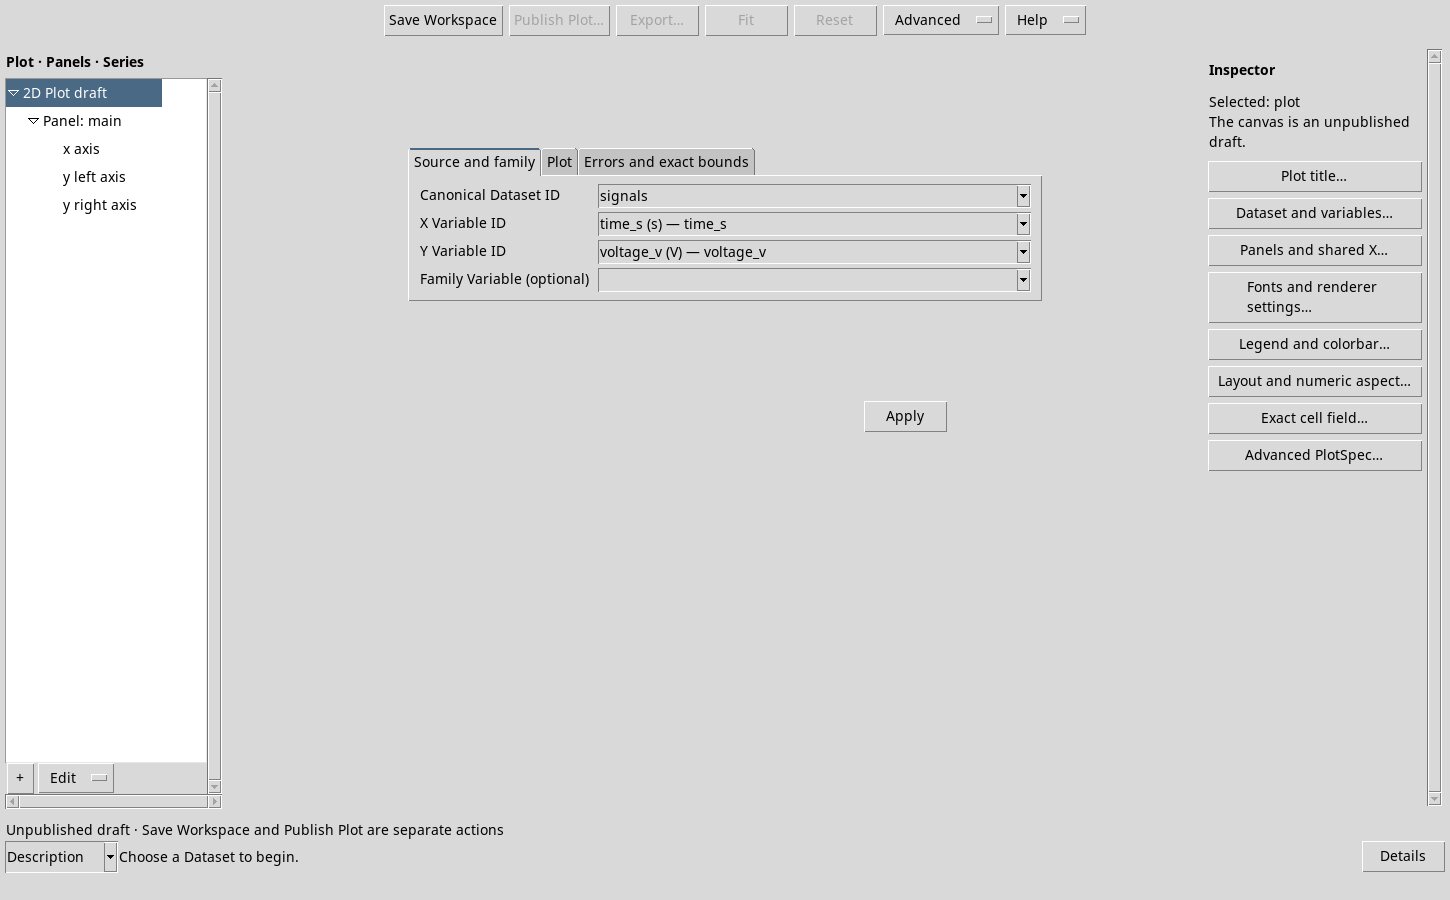
Select Add source…, choose the Dataset, and confirm with Apply. In the next dialog, choose X and Y and check their names, identifiers and units. In Plot, set the label, plot type and Y axis, then select Apply again.
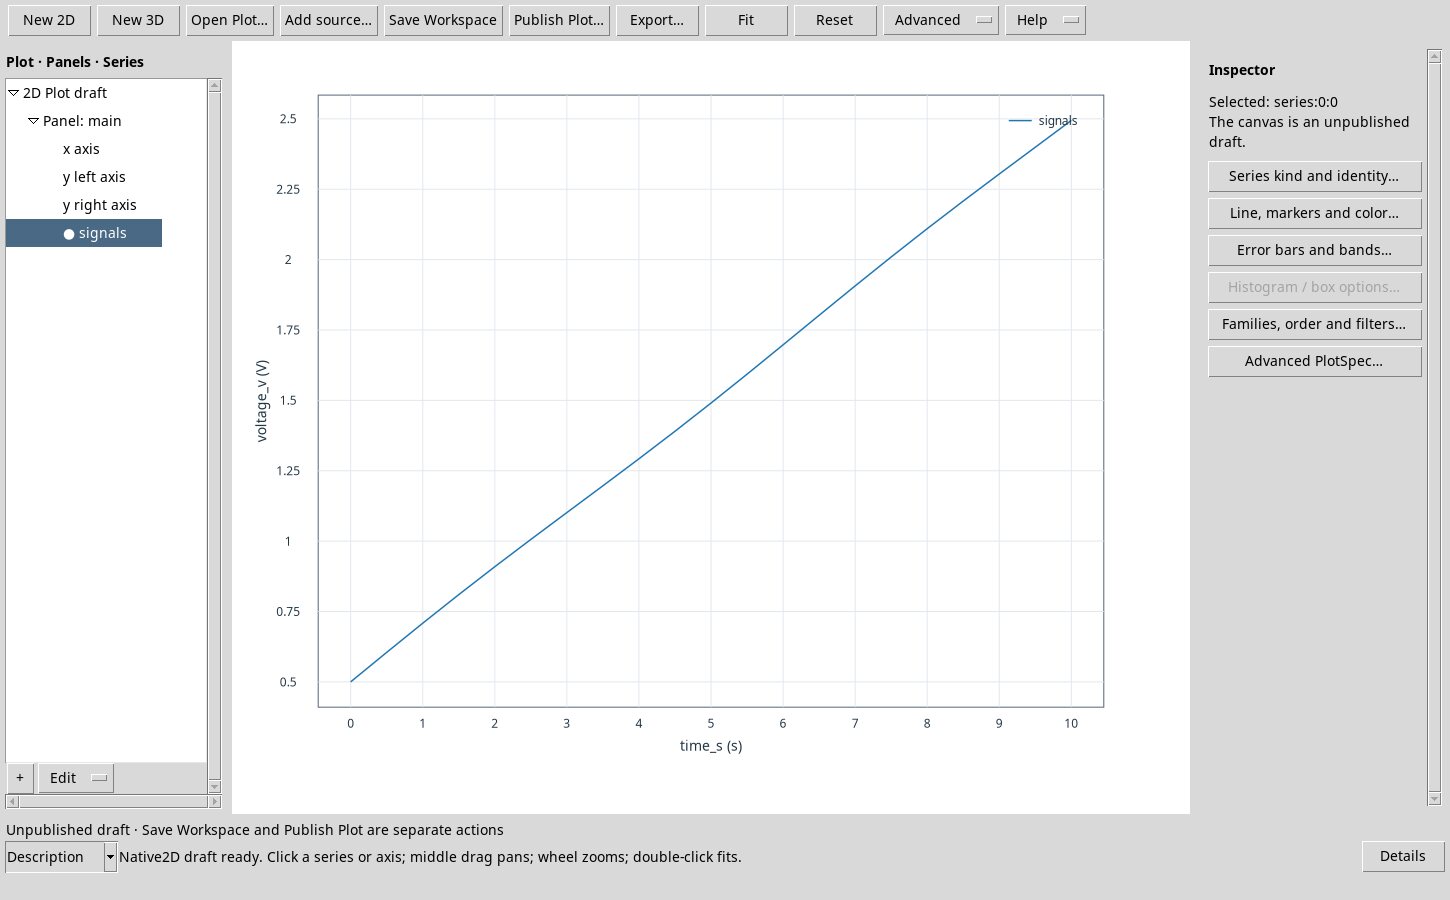
Select the series in the tree on the left. The Inspector on the right shows the commands available for that selection. Use Fit to fit the figure in the view.
Use Save Workspace to save the editable project. Use Publish Plot… to create a published entry in Plots.
Use Source and family to select the Dataset and coordinates. Plot and Errors and exact bounds contain the remaining settings.A first 2D series. The source tree selection determines what the Inspector shows.