

Fields — Legend and Layout
Select Plot and open Legend and colorbar…. Explicit settings here override the corresponding defaults in Fonts and renderer settings. A blank field removes its override where allowed.
| Field | Setting and effect |
|---|---|
| Placement | inside places the legend inside the chart; below, above, left and right respectively below, above, left and right. manual uses Manual X/Y; none hides the legend. |
| Inside anchor | With Placement inside, choose northeast, northwest, southeast or southwest for the top-right, top-left, bottom-right or bottom-left corner. north, south, east and west center it on the corresponding side. center centers it in the plot. |
| Layout | auto, row, stacked and wrapped arrange entries automatically, in one row, in a vertical stack or across wrapped rows, respectively. |
| Columns | Positive column count. Leave blank to let the renderer choose. In the tested 3D scene with two family entries, 1 used separate rows and 2 placed them on the same row. Check your selected layout. |
| Legend font size; Font unit | Text size and px/pt or inherit. The unit relates to the text, not data axes. |
| Alignment | start, center or end align at the beginning, at the center or at the end of the available space. In the 3D, the alignment controls the position of the entire external panel, not the justification of the texts; for an internal legend, choose Inside anchor instead. |
| Legend margin (px) | Legend margin in pixels. Increase it to add space and check the view. In the tested 3D outside legend, this field changed spacing when external_margin_px had no visible effect. |
| Manual X (% of full Plot canvas, left to right) | Horizontal coordinate from 0 to 100% of the full canvas, measured from the left, with Placement manual. The technical manual_x key uses a fraction: 0.5 equals 50% in the dialog. |
| Manual Y (% of full Plot canvas, bottom to top) | Vertical coordinate from 0 to 100% of the full canvas, measured from the bottom, with Placement manual. The technical manual_y key uses a fraction: 0.6 equals 60% in the dialog. The renderer can constrain placement to keep the legend readable. |
| Background setting; Background | Keep current retains the saved value, Custom RGB uses the entered #RRGGBB color, and Unset / inherit clears the override. Where available, None requests no fill and Transparent requests an explicitly transparent background. In this version’s 3D legend, Transparent can produce an opaque white rectangle. Use None to see the scene under the legend and check text readability. Select Apply to accept. |
| Border | Accepts inherit, 0 / 1, off / on or false / true. In this version’s 2D and 3D legends, false can still show the border. Use 0 or off to disable it, and 1, on or true to enable it. inherit depends on inherited settings. A disabled border hides any assigned color. |
| Border color setting; Border color | Keep current retains the saved color, Custom RGB uses the entered #RRGGBB color and Unset / inherit removes the override; the color is visible when Border is active. |
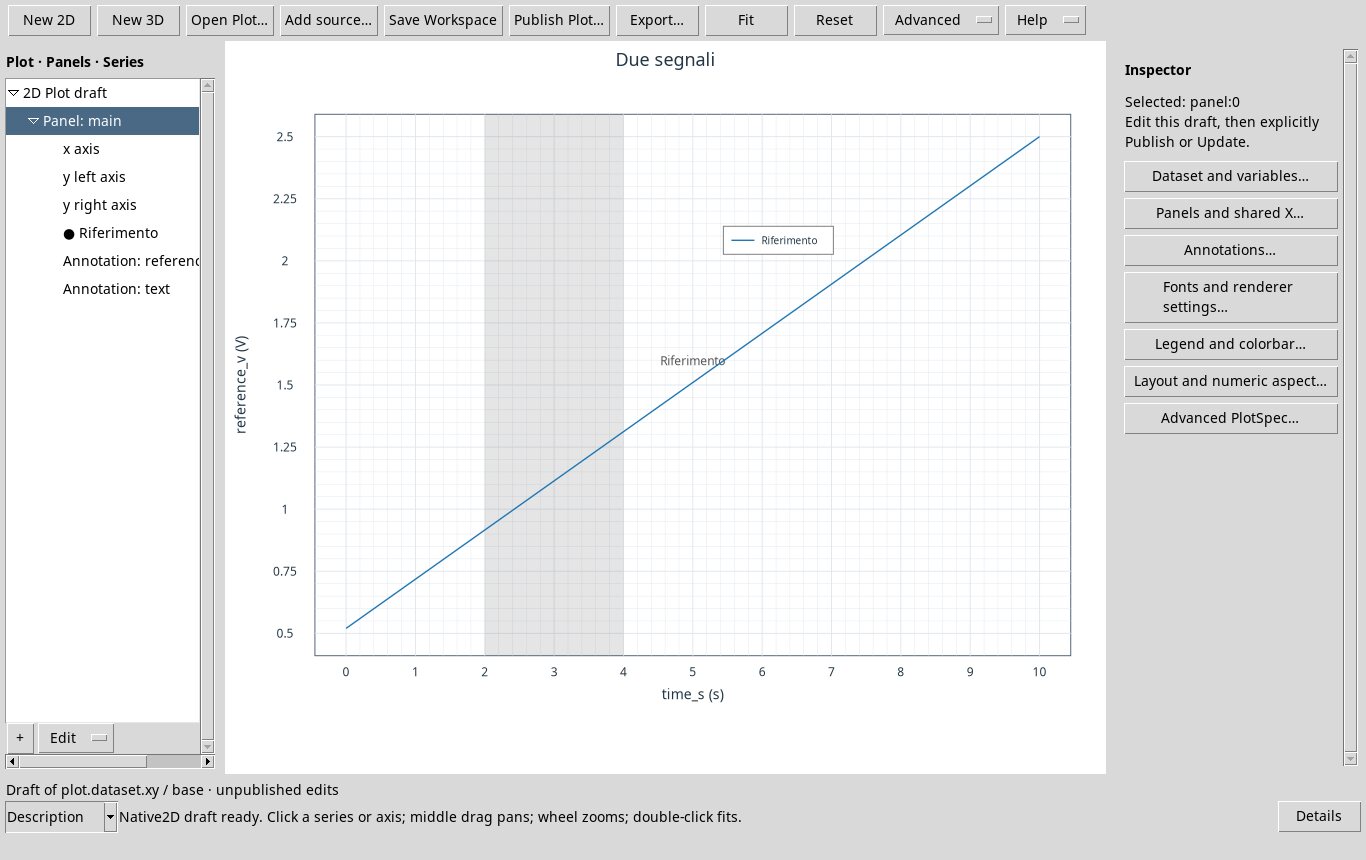
Layout and numeric aspect
Open the dialog from Plot. These numbers are renderer layout coordinates, independent of source units and legend percentages. A blank field keeps the automatic setting. After manual changes, check both the plot and the exported file.
| Field | Setting and effect |
|---|---|
| layout auto | inherit, 0 or 1 inherits, disables or enables automatic layout. |
| align ylabels | inherit, 0 or 1 inherits, disables or enables panel Y-label alignment. In a multi-panel 2D plot, the effect is visible when tick labels vary in width. The tested single 3D scene showed no visible differences. |
| layout ylabel allow negative | inherit, 0 or 1 controls whether the Y label may move to a negative position. Neither this flag nor the X-position field moved the Y label in the tested multi-panel 2D plot. The tested single 3D scene also showed no differences. |
| layout margin left; layout margin right; layout margin top; layout margin bottom | Margins of the figure on the respective sides. In the 2D are percentages of the width per left/right and the height per top/bottom; it leaves empty for the automatic or inherited choice. |
| layout gap | Separation of the panels; in the 2D is a percentage of the height of the canvas and is particularly visible in a multi-pannel figure. Empty leaves the automatic value. |
| layout ylabel dist; layout ylabel x | Distance and horizontal position of the Y label. In 2D, distance is a percentage of canvas width. In the tested multi-panel figure, the dialog accepted different ylabel x layout values without moving the labels. To reposition them, save the Workspace, open Advanced PlotSpec → Technical PlotSpec, enable editing, set native_presentation → axes → ylabel_x and use Validate and apply draft. Values of 0.1 and 0.4 put each label 10% and 40% of panel inner width from the left edge. Avoid covering the data. Remove the key and validate again to restore automatic placement. |
| layout legend dist; layout title dist | Spacing for the outside legend and title. In the tested multi-panel 2D plot with a visible title and legend above, values were accepted without moving these elements. Try moving the legend or adjusting the margins when more space is needed and check the layout. These settings need not produce the same spacing. |