

PlotSpec technical field reference
In Advanced PlotSpec… → Field reference the Viewer lists the types recognized by the original owner for the current figure. Open Technical PlotSpec to inspect the dictionary. Enable editing only if you know the schema. Validate and apply draft validates the entire proposal. These names identify structured data. The graphics, legend, axes, layout, plot_config and camera sections are under native_presentation. Panel overrides are under native_presentation → panels → panel ID. The default style is in defaults → style, series style is in its panels → series → style entry, and Model axis is under panels → axes → axis. Panels and series are lists. Preserve IDs and order when editing an entry. Spaces shown in the reference are underscores in dictionary keys. For example, x min maps to x_min. Available settings depend on the 2D or 3D plot type. Renderers may implement only a subset of the properties listed.
number types require finite values. boolean means true or false. vector is a numeric sequence and text_vector is a list of strings. Where the owner allows it, a blank value, auto, inherit and source mean absence, automatic choice, inheritance and the source unit, respectively. These are distinct from a numeric zero. An invalid edit is rejected and leaves the accepted draft intact.
Graphics, Legend, Layout and Camera
The chapters Fonts and renderer settings, Legend and Layout and Scene and Camera describe the meaning, values and limits of Graphics, Legend, Layout and Camera properties. The technical reference uses keys such as width_px for the visible field “width px”. In the 3D native_presentation → graphics section, aspect_mode accepts auto, xy_equal (equal X/Y scale), data_equal (equal X/Y/Z scale) and manual (explicit ratio). The GUI choice equal is subject to the issue described in the Graphics chapter. The dictionary also exposes the following fields.
| Technical property | Use and conditions |
|---|---|
| external_margin_px | External space required for the legend, in pixels. In the 3D surface with proven external legend, change the value has no visible effect: to adjust the distance use margin_px in the same dictionary or Legend margin (px) in the Legend and colorbar module…, then check the view. The two settings are not necessarily equivalent in the other layouts. |
| source_override_enabled | Controls precedence over the source legend: 0 retains the source choice and 1 enables an override. In the tested 3D surface with no family and Legend content set to auto, 0 showed no entries and 1 showed the series entry. Returning to 0 cleared the legend. The Dataset and graph owner remain unchanged. |
Axes
These keys control the renderer’s axis presentation. Prefer the Axis Inspector, which recognizes units and validates fields in context. The draft may contain an explicit title, labels and limits in its scientific fields. These can take precedence over the corresponding technical overrides. Check the rendered result and change the relevant scientific field if needed.
| Fields | Use and conditions |
|---|---|
| x_scale, y_scale, y2_scale, z_scale | Scale of X, left Y, right Y and Z. Linear and log have different domains. Log limits must be positive. In the tested 2D plot, x_scale=log, y_scale=log and y2_scale=log were accepted without changing the view. Select X, left Y or right Y and use Scales in the regular dialog. The X test was repeated with entirely positive data. With positive coordinates on the tested 3D surface, the technical x_scale, y_scale and z_scale also had no effect. Use Scales in the Axis Inspector. |
| xy_aspect_mode, aspect_mode, aspect_ratio | For xy_aspect_mode, inherit inherits, auto selects automatically, and xy_equal sets equal X and Y scales. For the 3D Axes field aspect_mode, choose inherit (inherited), auto (automatic), xy_equal (equal X/Y scales), data_equal (equal X/Y/Z scales), or manual with aspect_ratio. In the tested 3D surface, the Axes aspect_mode and aspect_ratio were accepted, but the view remained auto. The tested path is native_presentation → graphics → aspect_mode and, for manual, aspect_ratio. The ordinary Graphics field uses a different set of values. equal can be rejected. The Graphics chapter describes the technical xy_equal path. Check that the units are comparable. |
| x_unit, y_unit, y2_unit, z_unit, time_unit | Display units for the respective axes and time. They must be recognized and compatible with the source. In the tested 2D plot, x_unit=ms, y_unit=mV and y2_unit=A were accepted without changing units. Select the axis and use Display unit in the regular dialog. The technical X, Y and Z units also had no effect on the tested 3D surface. Use Display unit in the Axis Inspector. For numeric time in the tested 2D plot, time_unit=min was accepted without converting X from seconds. Use Display unit on the X axis. Conversion leaves the Dataset unchanged. Check the colorbar unit separately. |
| title, x_label, y_label, y2_label, z_label | Title or label text for each axis. A blank field may keep the owner’s automatic text. In the tested 2D plot, technical x_label, y_label, y2_label and title were accepted without changing text. Select X or Y and use Label in the regular dialog, or select Plot and use Plot title. The tested 3D surface also ignored technical X/Y/Z labels and the Axes title. Use Label in the Axis Inspector and 3D plot title in Scene. |
| x_min, x_max, y_min, y_max, y2_min, y2_max, z_min, z_max | Lower and upper limits in the displayed units of the respective axes. Enter ordered bounds valid for the scale. In the tested 2D plot, technical X, Y and Y2 were accepted without changing automatic limits. Select X, left Y or right Y in Sources and set Minimum and Maximum in Axis, units and bounds…. This worked on all three axes. In the tested 3D surface, technical X/Y/Z limits did not change the range. Use Minimum and Maximum in the Axis Inspector and verify the actual range. |
| x_step, y_step, y2_step, z_step | Positive major tick spacing in the displayed units of each axis. The renderer chooses it when no override is present. In the tested 2D plot, technical X, Y and Y2 steps did not change the ticks. Major step in the regular axis dialog worked for X, left Y and right Y. In the tested 3D view the technical X/Y/Z step settings also left ticks unchanged. Use Major step in the Axis Inspector. |
| z_format, zgrid | z_format controls the format of the text of the Z tick. For zgrid, inherit inherits, on shows the Z grid and off hides it, when the 3D owner supports it. |
| enabled, align_ylabels, ylabel_x, ygrid_source, grid_color | enabled is intended to toggle Axes presentation. In the tested 2D plot, 0 and 1 both left ygrid_source=none active. To remove the effect, explicitly delete the Axes key, validate and inspect the view. align_ylabels aligns panel Y labels. ylabel_x sets horizontal label position. ygrid_source selects the grid axis: left for left, right for right, none for none or inherit for inherited. |
| view_azimuth, view_elevation, projection | Angles and projection of the 3D view. In the test, when a saved camera existed, these Axes values were accepted without changing the camera. Use Native camera… to adjust Position, Target and Projection or orbit interactively, then verify the view. The measurements remain unchanged. |
| colormap, colorbar_visible, colorbar_label, color_unit, color_min, color_max, background | Palette, colorbar visibility and label, scalar mapping units and limits, and background. These apply when the figure uses scalar mapping. In the tested 3D surface, the six color keys and background under Axes were accepted without effect. Set them in Fonts and renderer settings… or in the technical Graphics branch. The Axes background also had no effect in the tested 2D plot. Use Background setting in Graphics. Verify limits in the selected color unit. |
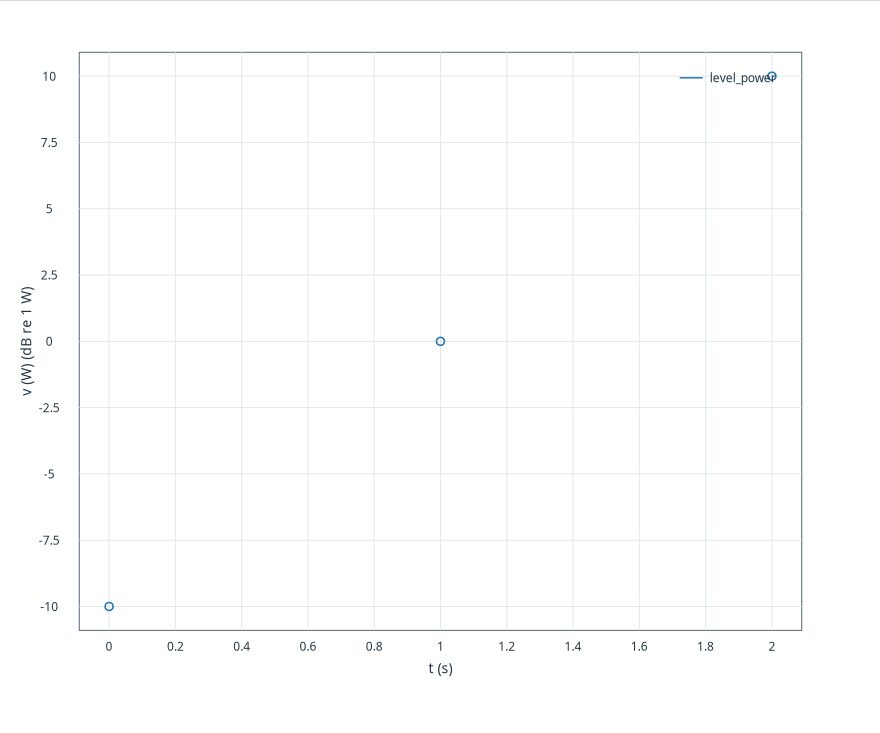
| x_level_scale, y_level_scale, y2_level_scale, z_level_scale | Level transformation dictionaries for each axis. The allowed keys are listed below. The transform requires an explicit scientific reference and leaves the source intact. In 3D, check the colorbar separately. Z can display dB while scalar mapping remains in the source unit. In this version’s 2D plot, x_level_scale can be accepted without transforming X or changing its label. If the derived transform is appropriate, create and publish a canonical variable with the formula and reference documented, then use that variable for X with no additional level transform. |
Level scale dictionary
| Key | Use and conditions |
|---|---|
| scale | linear retains a linear scale. dB uses 20 log10(|x|/ref) for amplitude and 10 log10(x/ref) for power. dBFS uses the logarithm relative to the declared full scale. FS displays x/ref and preserves its sign under the declared scale. The reference needs units compatible with the axis. Inputs already expressed in dB, dBFS or FS are not transformed again. Check explicit axis limits after transformation, as they may exclude the displayed range. |
| quantity_kind | amplitude or power specifies the kind of quantity for a nonlinear scale. |
| amplitude_basis | For amplitude, specify peak or rms. These are distinct conventions. |
| reference_value, reference_unit | Finite, positive reference value and its explicit unit, required for nonlinear scaling. |
| zero_policy | For logarithmic transforms, missing treats zero as missing and negative_infinity requests negative infinity. In this version, a series with zeros and missing can be rejected with “floating point value is Not a Number”, preserving the previous draft. If scientifically appropriate, apply a not_equal 0 predicate to the source variable before setting the scale. The Dataset remains intact. Document that zero points are excluded from the view. negative_infinity has a distinct meaning and must suit the intended transform. With FS, a zero input gives a zero ratio. Nonfinite values and negative powers do not produce valid samples. |
Style
The reference also exposes advanced style properties. In this version, validation rejects marker_edge_color, marker_face_color, fill_color, fill_opacity, edge_color, edge_width and hatch when entered in panels → series → style. An alternative path for those properties has yet to be verified. The ordinary dialog supports series color, line style, marker shape and fill, and overall opacity. The descriptions below give the intended use when the owner supports those fields.
| Fields | Use and conditions |
|---|---|
| color, line_style, line_width | Series color, line pattern and width. See Dataset, series and uncertainty for line and RGB options. |
| marker, marker_fill, marker_size | Marker shape, fill and size. Fill applies to symbols with an interior. |
| marker_edge_color, marker_face_color | Marker outline and interior colors when supported by the type and renderer. |
| fill_color, fill_opacity, edge_color, edge_width, hatch | Fill color and opacity, edge color and width, and a hatch pattern where supported. The effect depends on plot type. |
| opacity | Overall Opacity of the series: reducing it makes the representation more transparent without changing the values. |
Plot config
| Fields | Use and conditions |
|---|---|
| auto_reduce_threshold, chunk_rows | sets the valid-row threshold for automatic reduction and the read block size. The owner’s defaults are 12,000 and 5,000, respectively. With reduction_mode auto and 1,200 points, target 100 and threshold 2,000 kept 1,200 points, while threshold 500 displayed 101. chunk_rows requests the number of rows per block during preparation. In the 3D tests, values of 100 and 500 both kept 1,200 points with reduction set to none. The view receipt does not report the actual block count. When traced with the Native3D worker, both GUI values opened the stream in blocks of 4,096 rows. In that path, chunk_rows did not change the block size. Both settings leave canonical samples intact. |
| reduction_mode, target_points | Reduction policy and display target. See 3D Scene and Camera for choices and topology restrictions. |
| family_display_unit, family_label_prefix, legend_content | Compatible display unit for family values and a label prefix. auto leaves the choice to the owner. For example, family values of 1 and 2 m display as 100 and 200 cm, with the chosen prefix in the entries. legend_content accepts auto, none, series or family for automatic choice, no entries, series entries or available family members, respectively. Source identities are unchanged. |
| plot_type, plot_style, point_order | The 3D type selects geometry as described in the Scene chapter. For a 2D Graph, plot_style offers auto, line, scatter or line_markers for automatic, line, points or line with points, respectively. In the 2D test, this default applied with Series kind set to auto. An explicit type in the series takes precedence. point_order uses dataset_order for original order or sort_x to sort by X. auto is also available in 2D. Availability depends on the Graph. |
| line_width, marker_size, contour_levels | Line thickness, size of markers and number of levels: apply only to the types that use them. |
| extra_format | No additional output, SVG or PDF, as supported by the owner. On the tested 3D surface, technical plot_config/extra_format=pdf did not create a PDF on publication. Select pdf in Scene → Additional output format before Publish Plot and inspect the artifacts. SVG and 2D were outside the test. |
| title, x_label, y_label, y2_label, z_label | Figure title and axis labels according to Graph dimensionality. In the tested 3D surface, text in Plot config was accepted without a visible change. Use 3D plot title and the label fields in Scene. With a right axis in the tested 2D plot, y2_label was accepted without changing the text. Select the right Y axis in Sources, open Axis and set Label. The draft title can take precedence. Check the result. These settings change display text only. |
Model axis
| Fields | Use and conditions |
|---|---|
| label, display_unit, scale, direction | Label, compatible unit, scale and direction of an axis; choices and guards are in chapter axes and panels. |
| min, max, major_step, label_position_x | Limits, major tick spacing and horizontal axis-label position in the coordinates used by the owner. |
| format, tick_format, tick_label_mode | In this version, validation rejects format and tick_format when entered directly in panels → axes → x. For X formatting, a verified route is native_presentation → panels → panel ID → x_format, with %.2f for two decimals, for example. Apply and check the result. Keep the other fields and use formats accepted by the renderer. tick_label_mode and label_position_x are also rejected when added directly to Model axis X. The available edit paths have not been established for all listed properties. |
| grid, major_grid, minor_grid, grid_source | Overall, major and minor grid policies and the source axis. Effects depend on the renderer. This version rejects grid, major_grid and grid_source when added directly to Model axis X. For normal use, choose grid options in the Inspector. minor_grid for X was accepted. Listed keys may not be editable at that location. |
| tick_positions, tick_labels | Vector of tick positions and list of corresponding labels. They must have the same number of entries and be valid for the axis. |