

Getting started with Worksheet
Open the Scientific Worksheet viewer in GX-TXT and find the grid, inspector, toolbar, and sheet options.
Open the scientific worksheet
Open a GX-TXT session. On the Viewers tab, look for Worksheet and click its card. The window is called Scientific Worksheet. In a new Workbook the title shows Untitled Worksheet (unsaved) and the active sheet at the bottom is Sheet1.
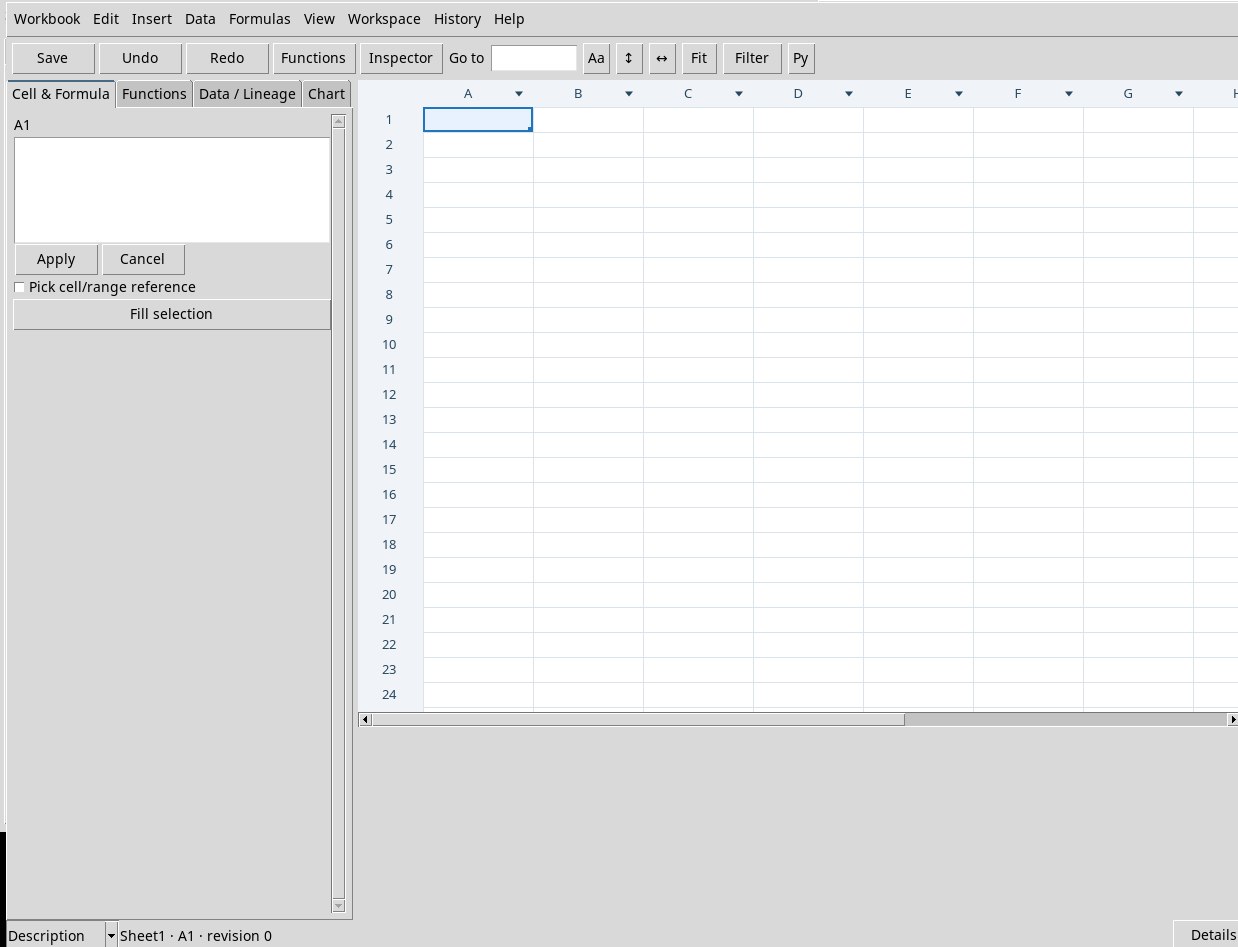
The Workspace name in the title refers to the whole Workbook. The dot ● marks the active sheet. The status strip shows the sheet, the cell and the revision, or the outcome of the last command. If a dialog stays open, read the status line too before repeating the action.
Find the grid, inspector, and menus
- Cell & Formula
- Read and edit the source content of the active cell. A formula remains visible as text in the editor and as a result in the grid.
- Functions
- Search the public names, read the signature, and insert the formula or fill in a guided operation. You can also open the tab from the toolbar or with F3.
- Data / Lineage
- Check the value, units, provenance, source row and statistical meaning, where available. The buttons at the bottom open the same functions as the Data menu.
- Chart
- Create and adjust native charts and publish a data snapshot in Plots. From Data → Charts / Publish… you can reopen the inspector and reach this tab.
- Scripts
- The tab appears when you open Edit → Scripts or click Py. The editor is used for explicit Python Jobs. The Workbook, formulas and charts still belong to the Workspace.
Resize the inspector by dragging the separator, or click Inspector to hide and show it. Long forms on the left have their own scroll bar. The grid has separate scroll bars for columns and rows. The context buttons depend on the selection and update when you move from cells to charts.
Navigate with the keyboard
Click a cell to activate it. Move around the grid with the arrow keys and use Go to with a coordinate, for example J16, then Enter. The domain is columns A–ZZ and rows 1–1,000,000. The grid grows when needed. Operations on a range have smaller limits.
| Command | Key in the grid or in the indicated editor |
|---|---|
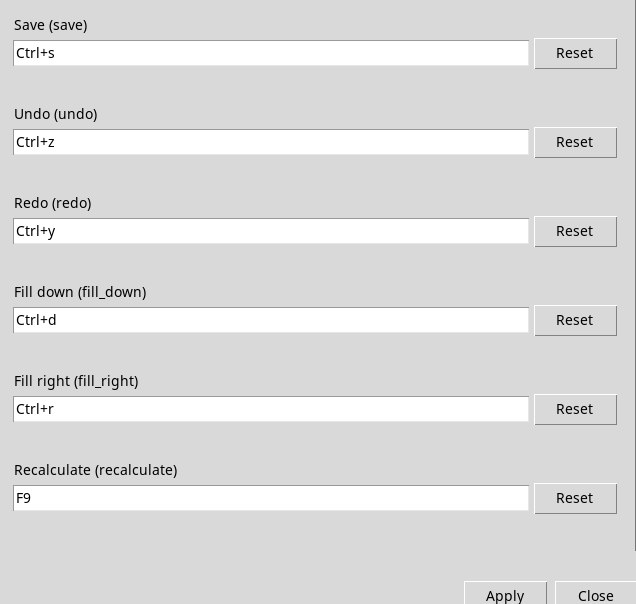
| Save, Undo, Redo | Ctrl+S, Ctrl+Z, Ctrl+Y |
| Copy, Cut, Paste, Clear | Ctrl+C, Ctrl+X, Ctrl+V, Delete |
| Select the populated area | Ctrl+A with focus on the grid |
| Fill down, Fill right | Ctrl+D, Ctrl+R |
| Recalculation, Functions, built-in help | F9, F3, F1 |
| Confirm or cancel the change | Enter in the grid editor, Ctrl+Enter in the inspector, Esc to discard the draft text |
With the editor in the grid, Enter confirms and moves down one row. Tab moves to the right and Shift+Tab to the left after confirming. The cell context menu opens with the right mouse button and selects the cell under the pointer.
Adjust the view and open Help
View → Show / hide left inspector is equivalent to Inspector. Description / History strip shows or hides the strip. Reset layout restores the inspector visibility, the panel width (300) and the font size, row height and column width (13, 25 and 110), where relevant. The sheet keeps the formulas and data already entered.
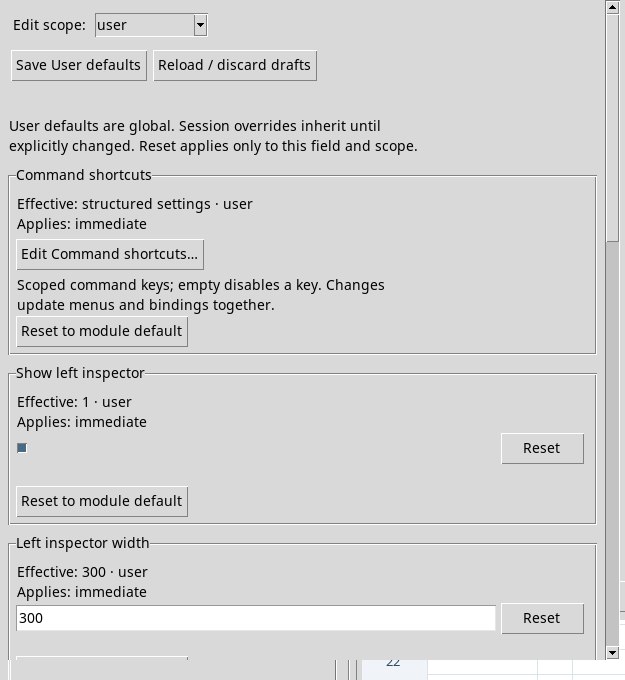
In View → Viewer configuration…, set Edit scope to user for reusable settings or session for the current Session. Check Effective before changing a field. Save User defaults or Save Session overrides applies the settings in the current scope. Reload / discard drafts reloads the active values. Resetting a value in the Session scope can make it inherit the user value again.
- Show left inspector, Left inspector width
- Panel visibility and width 140–1,200 px, initially 300.
- Grid font size, Grid row height, Grid column width
- Default grid dimensions. The ranges are 6–72, 16–200 px and 35–2,000 px, with initial values 13, 25 and 110. For local exceptions, use the table editor commands.
- Grid number format, Grid display digits
Generalis the general view.Scientificshows an exponent,Fixeduses fixed decimals. The number of digits ranges from 1 to 17, initially 8. The display precision is separate from the value used in the calculation.- Individual column widths
- Sets default widths by column index with pairs such as
1 135 4 160. Indices range from 1 to 702, widths from 35 to 2,000 px. An empty field uses the general width. - Description / History strip
- Open the settings editor to choose the initial view, the visibility and the grouping of operations. The strip can also be adjusted from the Viewer.
In Edit Command shortcuts… each row associates a command with its key sequence. Leave a command empty to disable its key. For example, replace the Functions sequence with F4, click Apply in the editor and Save Session overrides in the configuration. Return to the grid and press F4 to show Functions. Reset to User default removes the override.
Edit Description / History strip… controls the visibility of the strip, the initial mode Description or History and the grouping of consecutive operations. Apply the configuration in the chosen scope. Expand a group from the strip menu to inspect the individual steps.
Help → User Manual… or F1 opens the integrated manual. About Module… shows the identity of the module. This guide shows Scientific Worksheet 2.1.2 in GX-TXT 0.9.8.10-dev-112-p011.