

GX-TXT-v3: First Measurements with a Real Photodiode and IR Remote Control
After characterizing the GX-TXT-v3 using the virtual photodiode, it is time to move on to the operating condition for which the circuit was actually designed: receiving the infrared signal produced by a real remote control.
In the previous tests, the virtual photodiode allowed me to apply controlled and repeatable signals to the board, separately studying the effect of equivalent current, sensitivity adjustment, and pulse count on the HOLD node and LED on-time.
The last part of this characterization is described in the previous article:
GX-TXT-v3: pulse count, HOLD voltage, and LED on-time
In this new session I therefore replace the artificial current generator with a real photodiode and use a standard IR remote control as the source. The goal is not yet to perform an absolute optical-power measurement, but to observe how the circuit responds to a real signal and begin experimentally characterizing its receive chain.
In particular, I want to observe the received signal directly, identify the IR carrier, analyze the burst structure, and verify how these signals propagate through the GX-TXT-v3 up to the charging of the HOLD node and the resulting LED activation.
Because measurement geometry also becomes important when moving to a real optical source, I prepared a very simple setup to keep the distance and relative position between the remote control and photodiode as constant as possible. It is not a precision optical bench, but it is reproducible enough for comparative measurements under the same conditions.
For all acquisitions I kept a distance of about 20 cm between the photodiode and the remote control’s IR emitter. Distance and position were checked using the ruler and the visible references in the setup.
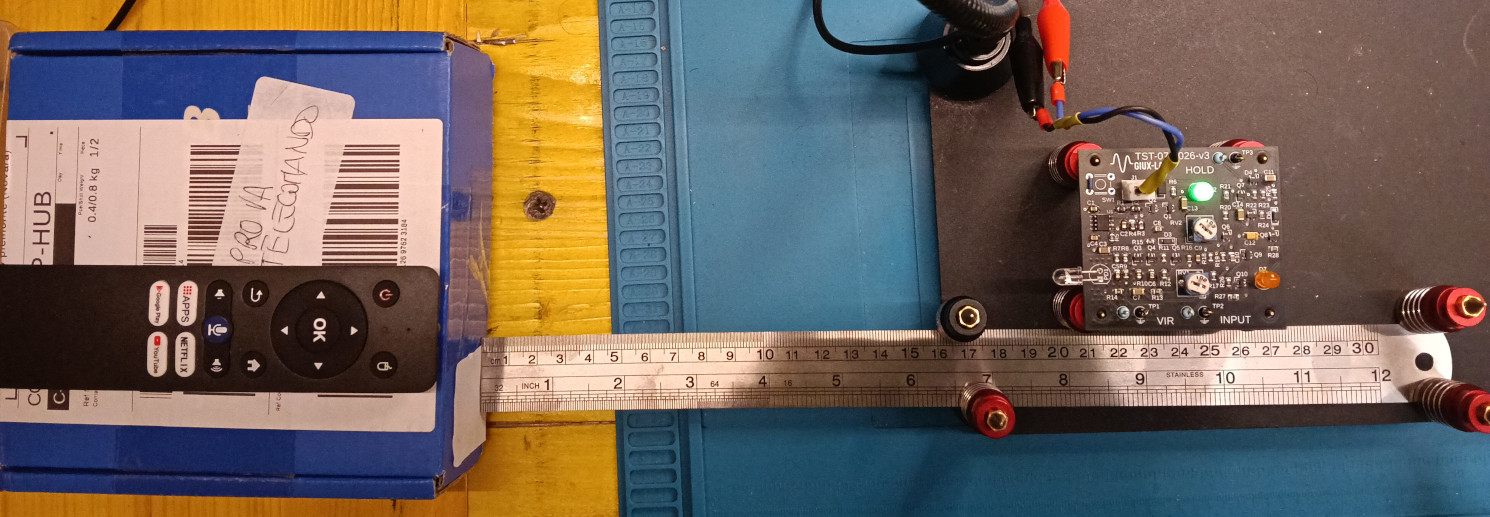 Setup utilizzato per le prove con fotodiodo reale. La riga, il riferimento sulla scatola e la posizione della scheda permettono di ripetere la geometria di misura con sufficiente accuratezza per confronti relativi.
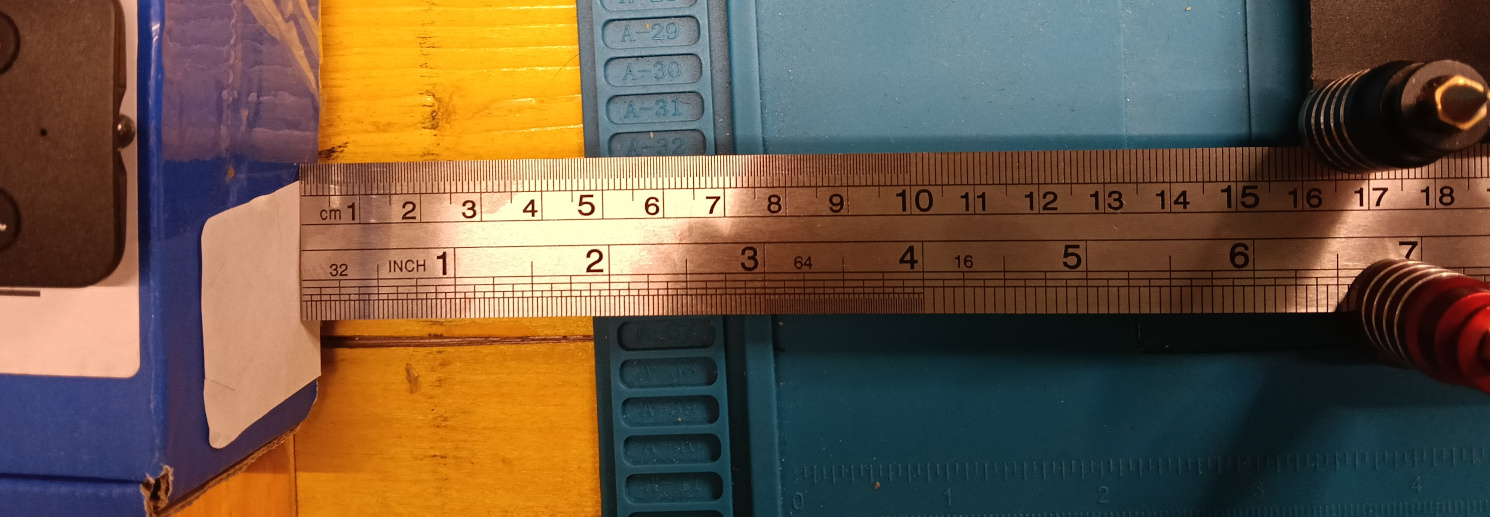
Photodiode used
For these tests I used an EVERLIGHT PD333-3C/H0/L2, a silicon PIN photodiode in a transparent 5 mm plastic package, selected as the IR receiver for the GX-TXT-v3.
The device has a spectral sensitivity approximately from 400 to 1100 nm, with peak sensitivity at 940 nm, directly within the range commonly used by infrared LEDs in remote controls. The datasheet also specifies typical rise and fall times of about 45 ns and a typical total capacitance of 18 pF, making it more than adequate for following the approximately 38 kHz carrier used in these tests.
The datasheet also specifies a typical illuminated reverse current of about 40 µA at an irradiance of 1 mW/cm² and 940 nm, and a typical dark current of about 5 nA. These values refer to the device characterization conditions and must not be confused with the current actually produced in the experimental setup used for these measurements.
Official Everlight datasheet: PD333-3C/H0/L2 – datasheet PDF
Why the VIR amplitude does not directly provide the photocurrent
The amplitude measured at the VIR node cannot be converted directly into the photocurrent generated by the photodiode. With the virtual photodiode, the current could easily be obtained from the voltage across the resistor connected to the transistor emitter, because that node had a known and essentially unambiguous voltage-to-current relationship. In the real circuit, however, the photodiode operates directly on the VIR node, and the observed voltage also depends on the equivalent impedance presented by the entire input stage, which was not measured in this test. For this reason, the VIR excursion should be considered here as a measure of the received-signal amplitude, not as a direct measurement of photocurrent.
VIR signal processing with GNU Octave
The complete VIR-node acquisition contains a very large number of samples, so analyzing it only by looking at the oscilloscope trace would not be practical. I therefore exported the signal as CSV and developed a dedicated GNU Octave script, GXTXT_analisi_VIR_protocollo_v2_2.m, for reconstructing the time structure of the IR command.
The script reads the CSV format generated by the Rigol directly, reconstructs the time axis using the Start and Increment parameters, and before beginning the full analysis performs a quick pretest to verify that the file is readable and that the signal actually contains a carrier compatible with the expected one.
The analysis automatically determines the VIR idle level, pulse polarity, carrier frequency and period, pulse width, and duty cycle. It then groups consecutive carrier cycles into the different MARKs, measures the SPACE intervals separating them, and determines the duration and number of cycles for each burst.
The program also produces a complete table of MARK/SPACE events, a numerical summary, and several plots that make it possible to move from the analog waveform acquired from the photodiode to a much more readable timing representation of the transmitted command.
The script deliberately does not try to assign a protocol name immediately: the idea is first to reconstruct the carrier, bursts, and timing intervals experimentally, and only afterwards compare these data with the structure of known IR protocols.
For anyone who wants to use or modify the script, I also prepared a short user manual describing the required data format, the pretest, verbosity levels, the main configurable parameters, generated files, and instructions for running it on a PC or server.
Download script:
Results of the VIR-node acquisition
To observe the entire transmission without losing carrier detail, I performed a second, longer acquisition with only one channel active on the VIR node. The oscilloscope was set to 50 ms/div with a 12 Mpts memory depth and a 10 MSa/s sampling rate.
The resulting CSV therefore contains 12 million samples and covers about 1.2 s, a window much longer than the actual duration of the observed transmission. This makes it possible to verify that the events in the recording are not truncated by the end of the acquisition.
The oscilloscope trace clearly shows a first, much more complex sequence followed several tens of milliseconds later by an additional isolated burst. At this time scale the individual carrier cycles cannot be distinguished on the oscilloscope display, but they remain fully preserved in the acquired data thanks to the 10 MSa/s sampling rate.
IR carrier
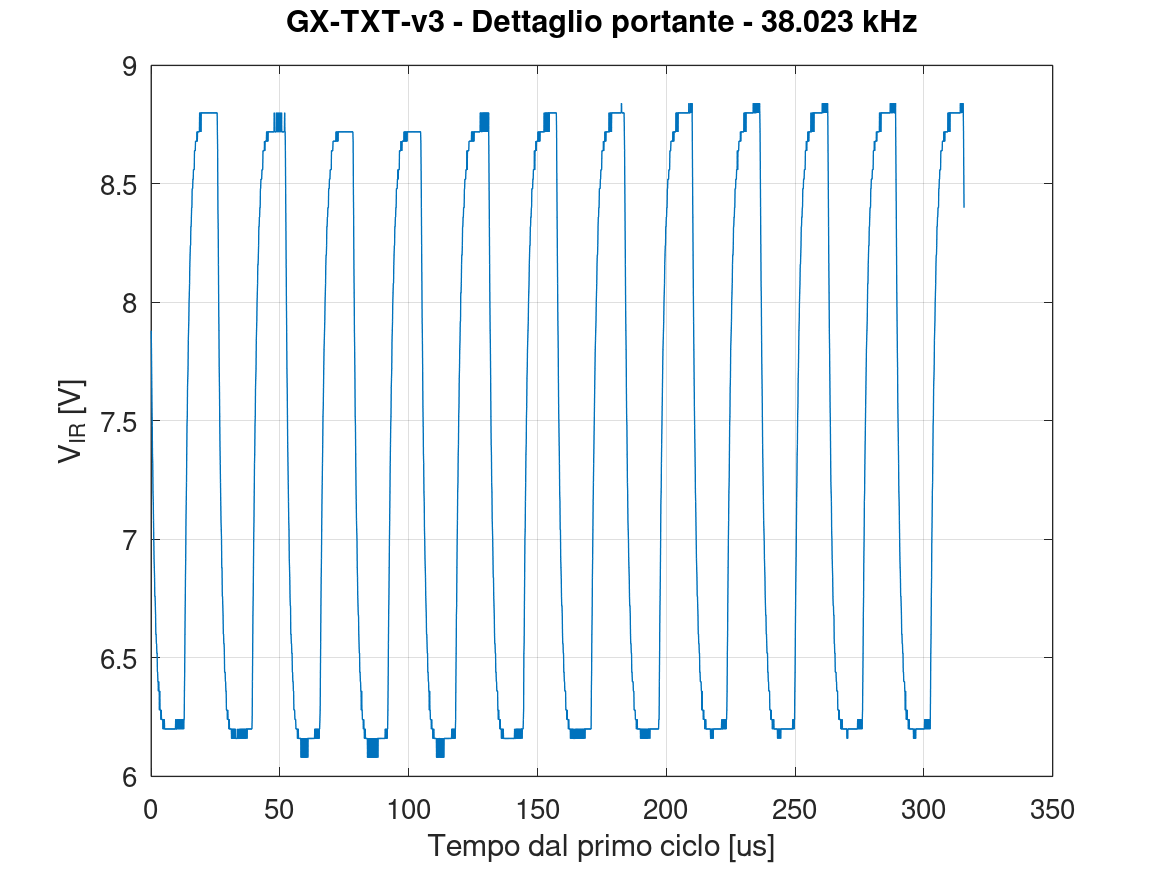
GNU Octave processing measures a median carrier period of 26.3 µs, corresponding to a frequency of 38.0 kHz.
The median pulse width detected on the VIR node is 15.1 µs, from which the script derives an apparent duty cycle of 57.4%.
This value does not directly represent the duty cycle used to drive the remote control’s IR LED. The measurement is made at the VIR node after the photodiode’s optical-to-electrical conversion and through the analog response of the input stage; moreover, the script determines pulse duration relative to a threshold set at 30% of the detected excursion. The value should therefore be interpreted as a characteristic of the waveform observed at VIR, not as a direct measurement of the transmitter’s optical duty cycle.
The waveform detail also shows that the signal at the VIR node is not a simple ideal square wave: the edges are rounded and the amplitude varies slightly from cycle to cycle. This is entirely consistent with the fact that we are directly observing the behavior of the photodiode and analog input stage rather than the digital output of an integrated IR receiver.
Transmission timing structure
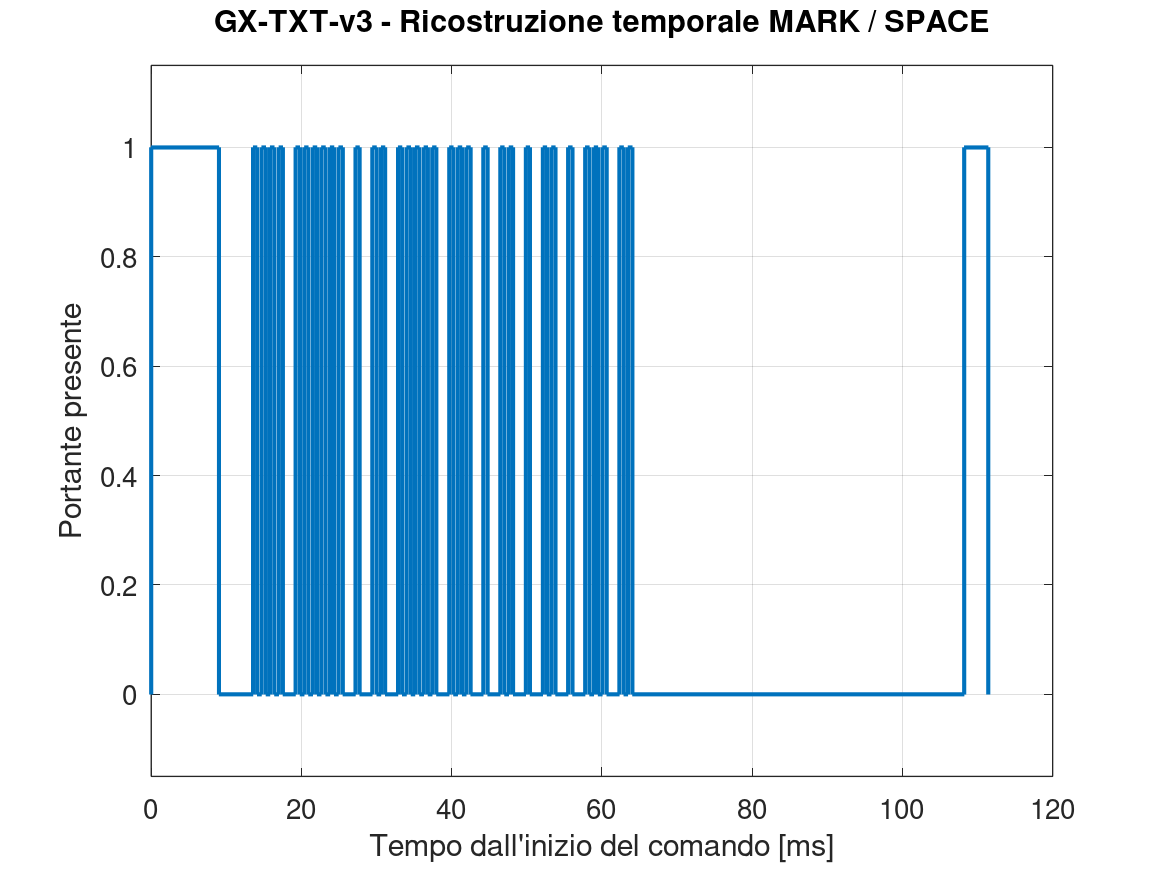
The script identified a total of 35 intervals in which the carrier is present, labeled MARK, separated by intervals without carrier, labeled SPACE. The overall section between the first and last recognized event lasts about 111.4 ms.
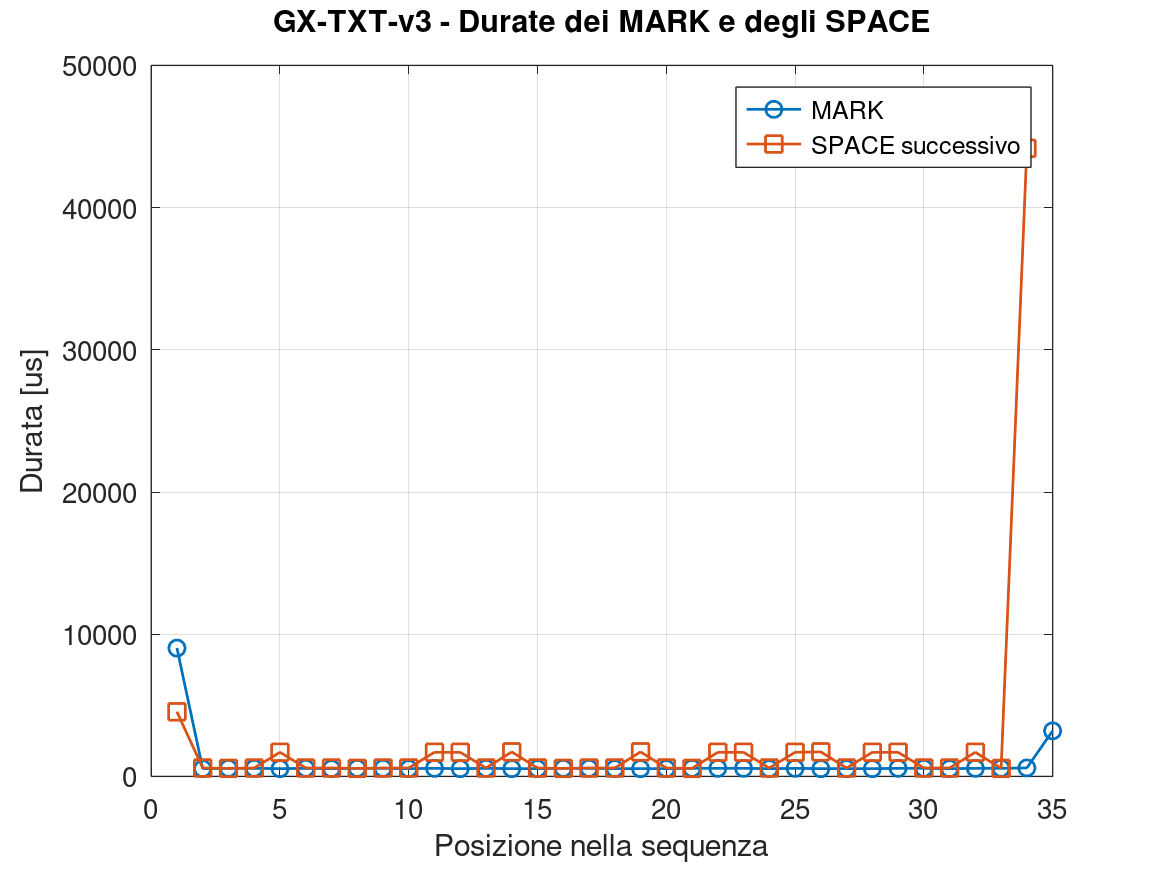
The durations are not randomly distributed, but cluster into a few clearly distinct groups. Of the 35 detected MARKs, 33 have a median duration of about 568 µs; there is also one MARK of about 9.02 ms and another isolated MARK of about 3.20 ms.
| Event | Characteristic duration | Number of occurrences |
|---|---|---|
| Short MARK | 568 µs | 33 |
| Long MARK | 9.021 ms | 1 |
| Final isolated MARK | 3.201 ms | 1 |
| Short SPACE | 590.6 µs | 20 |
| Long SPACE | 1.6966 ms | 12 |
| Long initial SPACE | 4.5404 ms | 1 |
| Very long SPACE | 44.1726 ms | 1 |
Two recurring SPACE families are particularly evident, one around 0.59 ms and another around 1.70 ms. The MARKs associated with the central part of the transmission also have a substantially constant duration.

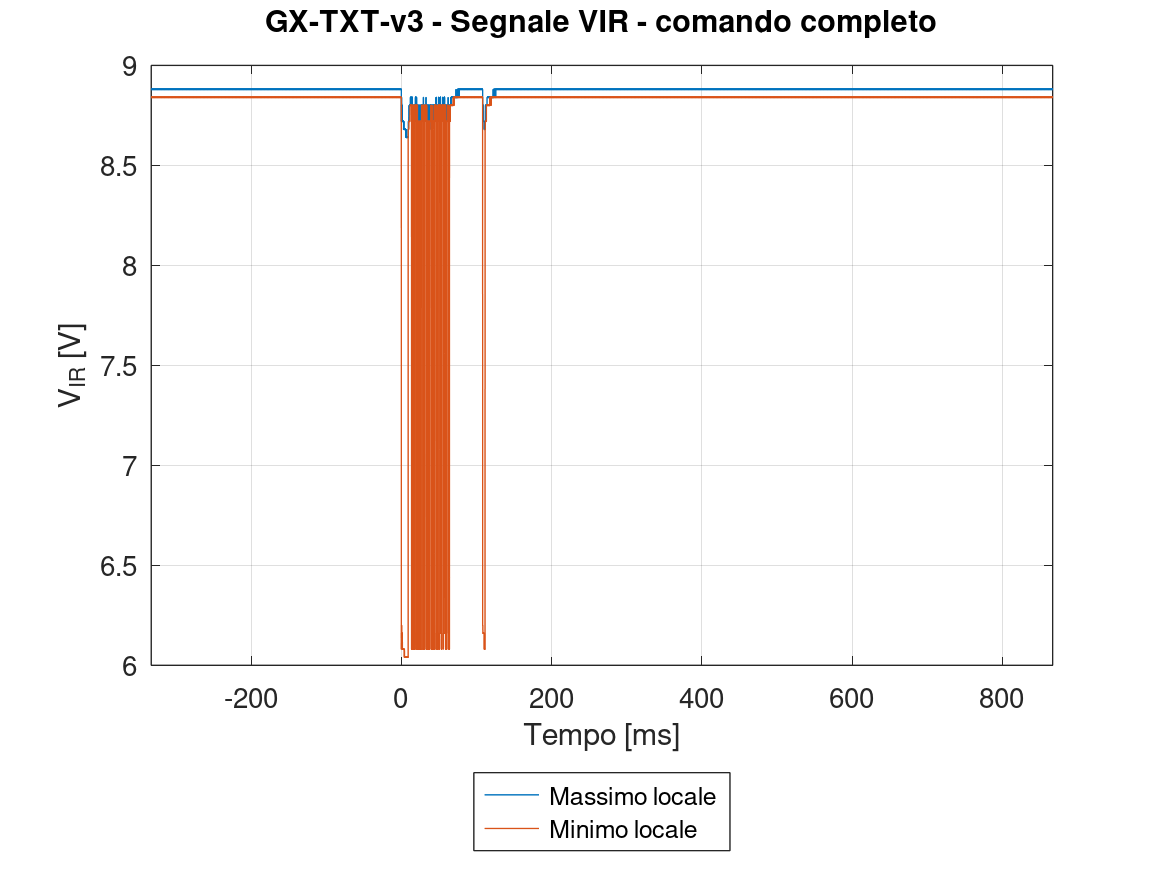 Rappresentazione dell'intera acquisizione del nodo VIR mediante massimo e minimo locale. La lunga finestra temporale permette di distinguere la trasmissione dal restante intervallo di quiete.
How to read the summary
GX-TXT-v3 - VIR / IR PROTOCOL ANALYSIS - V2.4
============================================================

CSV                  : VIR_10x_DC_50ms_12M.csv
Samples              : 12000000
Sample rate          : 10.000000 MSa/s
Acquisition duration : 1199.999900 ms

VIR
------------------------------------------------------------
Baseline             : 8.880000 V
Polarity             : downward pulses
Pretest amplitude    : 2.840000 V
Threshold            : 0.852000 V relative to baseline

CARRIER
------------------------------------------------------------
Median period        : 26.300000 us
Frequency            : 38.022814 kHz
Median pulse width   : 15.100000 us
Estimated duty cycle: 57.414 %

COMMAND
------------------------------------------------------------
Burst MARK           : 35
Start                : -0.015100 ms
End                  : 111.415900 ms
Duration             : 111.431000 ms

MARK CLASSES [us]
Class       Median         Mean           Min          Max        N
     1      568.000      556.879      541.600      594.400       33
     2     3201.400     3201.400     3201.400     3201.400        1
     3     9021.100     9021.100     9021.100     9021.100        1

SPACE CLASSES [us]
Class       Median         Mean           Min          Max        N
     1      590.600      584.020      564.200      590.700       20
     2     1696.600     1703.175     1696.500     1722.900       12
     3     4540.400     4540.400     4540.400     4540.400        1
     4    44172.600    44172.600    44172.600    44172.600        1
The summary file collects the main numerical results automatically obtained by the script in compact form. The first section describes the acquisition: number of samples, sampling rate, and total recording duration. It is followed by the VIR-node parameters: idle level, signal polarity, amplitude detected during the pretest, and the threshold used to identify carrier presence.
The CARRIER section reports period, frequency, median pulse width, and duty cycle. In the analyzed case, the measured frequency is about 38.0 kHz, with a period of 26.3 µs.
The COMMAND section indicates how many MARKs were recognized and the time interval between the first and last detected event. Finally, the MARK CLASSES and SPACE CLASSES tables automatically group similar durations, reporting their median, mean, minimum, maximum, and number of occurrences. This division into a small number of recurring timing classes is what makes it possible, in the next step, to reconstruct the logical encoding of the command without manually interpreting millions of samples.
From signal to IR protocol
Once the MARK/SPACE sequence has been reconstructed, the next step is to determine which protocol produced that particular timing structure. Knowing the carrier frequency alone is not sufficient: many protocols use very similar frequencies, often between 36 and 40 kHz.
To recognize a protocol, several elements should therefore be considered together: carrier frequency, encoding type, initial header duration, elementary MARK and SPACE durations, number of transmitted bits, and behavior during command repetition.
A particularly useful first element is how bits are represented. In pulse distance protocols such as NEC, it is mainly the SPACE duration that distinguishes a 0 from a 1, while the MARK remains nearly constant. In pulse width protocols such as Sony SIRC, essentially the opposite occurs. RC5 and RC6 instead use biphase encoding, where information is associated with signal transitions.
| Protocol | Typical carrier | Encoding | Typical header | Characteristic timing | Typical length |
|---|---|---|---|---|---|
| NEC | 38 kHz | Pulse distance | MARK 9 ms + SPACE 4.5 ms | MARK ≈560 µs; SPACE ≈560 / 1690 µs | 32 bits |
| Samsung | 38 kHz | Pulse distance | MARK ≈4.5 ms + SPACE ≈4.5 ms | MARK ≈560 µs; SPACE ≈560 / 1680 µs | 32 bits, with variants |
| Panasonic / Kaseikyo | 37 kHz | Pulse distance | MARK ≈3.46 ms + SPACE ≈1.73 ms | MARK ≈432 µs; SPACE ≈432 / 1296 µs | 48 bits |
| Sony SIRC | 40 kHz | Pulse width | MARK ≈2.4 ms | MARK ≈600 / 1200 µs; SPACE ≈600 µs | 12, 15, or 20 bits |
| Philips RC5 | 36 kHz | Biphase / Manchester | Does not use an NEC-like leader | Timing unit ≈889 µs | About 14 logical intervals |
| Philips RC6 | 36 kHz | Biphase | MARK ≈2.67 ms + SPACE ≈0.89 ms | Timing unit ≈444 µs | Depends on the variant |
The table is intentionally concise and is intended only as a recognition guide. Numerous variants exist, and different protocols may share some characteristic timings. For a more complete discussion, I refer to the cited sources rather than reproducing their detailed descriptions here.
Sources used for IR protocol comparison
I mainly used two references for the protocol comparison. SB-Projects – IR Remote Control Theory provides a very clear explanation of IR transmission principles, carrier modulation, MARKs and SPACEs, and the different encoding techniques; the pages dedicated to individual protocols are useful for examining their structure and timing in more detail. link to SB-Projects – IR Remote Control Theory Arduino-IRremote is instead a particularly useful reference for checking currently supported protocols, carrier frequencies, and the distinction between pulse distance, pulse width, and biphase/Manchester encoding. The library includes, among others, NEC, Samsung, Panasonic/Kaseikyo, Sony, RC5, and RC6. link to Arduino-IRremote
Automatic protocol identification
After reconstructing the MARK/SPACE sequence, I used a second GNU Octave script, GXTXT_identifica_protocollo_IR_v1.m, to automatically compare the experimental data with some of the most common IR protocols.
The script uses the eventi_mark_space.csv file produced by the previous analysis and simultaneously considers carrier frequency, header structure, MARK and SPACE durations, and the number of recognized bits. The protocols considered in this first version are NEC family, Samsung, Panasonic/Kaseikyo, Sony SIRC, Philips RC5, and Philips RC6.
The result is not decided on the basis of a single parameter: each protocol is assigned a score representing how far the measured timings deviate from the expected values. The lower the score, the better the match. When the structure allows it, the script also attempts to reconstruct the transmitted bit sequence and bytes directly.
GX-TXT-v3 - IR PROTOCOL IDENTIFICATION - V1
============================================================

Source events  : eventi_mark_space.csv
Carrier        : 38.022814 kHz

RANKING
------------------------------------------------------------
1) NEC family             score=  0.0084   HIGH
   header err 0.006, carrier err 0.001, data err 0.019, mark err 0.014, bit=32
2) Samsung                score=  0.1877   POSSIBLE
   header err 0.514, carrier err 0.001, data err 0.026, mark err 0.014, bit=32
3) Sony SIRC              score=  0.2058   POSSIBLE
   header err 0.389, carrier err 0.049, bit-mark err 0.053, space err 0.060, bit=28
4) Philips RC5            score=  0.2212   POSSIBLE
   carrier err 0.056, header err 0.000, biphase-unit err 0.361
5) Philips RC6            score=  0.3053   LOW
   carrier err 0.056, header err 0.561, biphase-unit err 0.271
6) Panasonic / Kaseikyo   score=  0.3279   LOW
   header err 0.423, carrier err 0.028, data err 0.329, mark err 0.315, bit=19

RESULT
------------------------------------------------------------
Best candidate    : NEC family
Score               : 0.0084
Confidence        : ALTA
Recognized bits   : 32
Bit TX-order         : 00010000011010000100110110110010
Byte LSB-first       : 0x08 0x16 0xB2 0x4D
NEC addr complement : NO
NEC cmd complement  : SI
Interpretation      : NEC extended / possible NEC-family variant

NOTE
Identification is based on measured timings. Protocols or variants
sharing the same modulation may require analysis of the payload,
repeat frame, or behavior during long button presses.
Interpreting the result
The comparison identifies the NEC family by a clear margin: the resulting score is 0.0084, classified by the script as high confidence, while the second candidate, Samsung, reaches only 0.188. Exactly 32 bits are also recognized.
The reconstructed sequence corresponds to the four bytes 08 16 B2 4D, interpreted in LSB-first order. The command byte, 0xB2, is correctly followed by its complement 0x4D, while the first two bytes are not complements of each other. For this reason, the script does not classify the frame as standard NEC, but as NEC extended or another NEC-family variant, with 16-bit address 0x1608 and command 0xB2.
It is important to distinguish the two levels of analysis: the measured timings provide strong evidence that the protocol belongs to the NEC family; the more specific interpretation as NEC extended instead comes from the four-byte structure and should therefore be considered the next decoding step, not simply the result of the carrier measurement.
Decoding consistency checks
The results also allow several independent internal checks. The frame contains 33 short MARKs, while 32 bits are decoded: the additional MARK is exactly the one required to close the transmission of the final bit. The observed structure is therefore consistent even from a simple event count.
A second check is obtained by counting the SPACEs. The data portion contains 20 short SPACEs and 12 long SPACEs, for a total of 32 bits. In the reconstructed encoding, long SPACEs correspond to logical 1 bits: counting the 1s in the four bytes 08 16 B2 4D gives exactly 12. The timing-event count and byte decoding therefore independently lead to the same result.
The overall timing provides further confirmation. After the main frame ends, a SPACE of about 44.17 ms is measured followed by a new MARK; adding the duration of the preceding frame, this new event begins about 109 ms after the start of the first transmission, a value compatible with the NEC-family repeat period, on the order of 108–110 ms.
The final MARK, however, lasts only about 3.20 ms and therefore does not constitute a complete NEC repeat, which should begin with a MARK of about 9 ms followed by a SPACE of about 2.25 ms. One possible explanation is that the transmission was interrupted when the button was released during the beginning of the repeat; this interpretation remains a hypothesis and can easily be checked with a new acquisition while holding the button down longer.
Conclusions
With these measurements, the GX-TXT-v3 moved from the virtual photodiode used in previous characterizations to a real IR source. The test was deliberately limited to a single remote control and direct observation of the VIR node: the aim was not yet to characterize the entire amplification and detection chain, but to determine what could be obtained directly from the signal produced by the photodiode.
The result is already quite comprehensive. The VIR signal makes it possible to clearly observe the approximately 38.0 kHz carrier, distinguish the individual bursts, reconstruct the MARK/SPACE sequence and, starting solely from oscilloscope data, obtain the transmitted binary sequence and identify the protocol family.
The software tools developed during the test have also become part of the measurement system: the first script transforms the oscilloscope CSV into a timing description of the signal, while the second compares the resulting sequence with several common IR protocols. This keeps the experimental observation separate from the subsequent interpretation of the data.
This test does not yet represent a complete characterization of the GX-TXT-v3. I mainly observed the VIR node and used only one remote control; it therefore remains to be studied how different signals pass through the subsequent circuit stages and how their characteristics affect the HOLD node and, ultimately, LED on-time.
The next step will therefore be to test several real remote controls, acquire their signals, and experimentally identify their protocols. It will not be necessary to repeat extremely detailed acquisitions like the one used in this article for every remote: once the method has been verified, the comparison can focus on carrier frequency, burst structure, and recognized protocol.
A second series of tests can then return to the behavior of the GX-TXT-v3 itself. The idea is to choose a reference remote control, adjust the GAIN trimmer to obtain a defined condition with the SENSE trimmer approximately at mid-travel, and use that configuration to compare different remote controls, focusing especially on the voltage reached at HOLD and the resulting LED on-time. This will finally make it possible to connect the characteristics of the real IR signal to the overall response of the circuit.