

Run the IR Analysis
Input, preprocessing, ranking, and canonical outputs.
Specify the measured spectrum
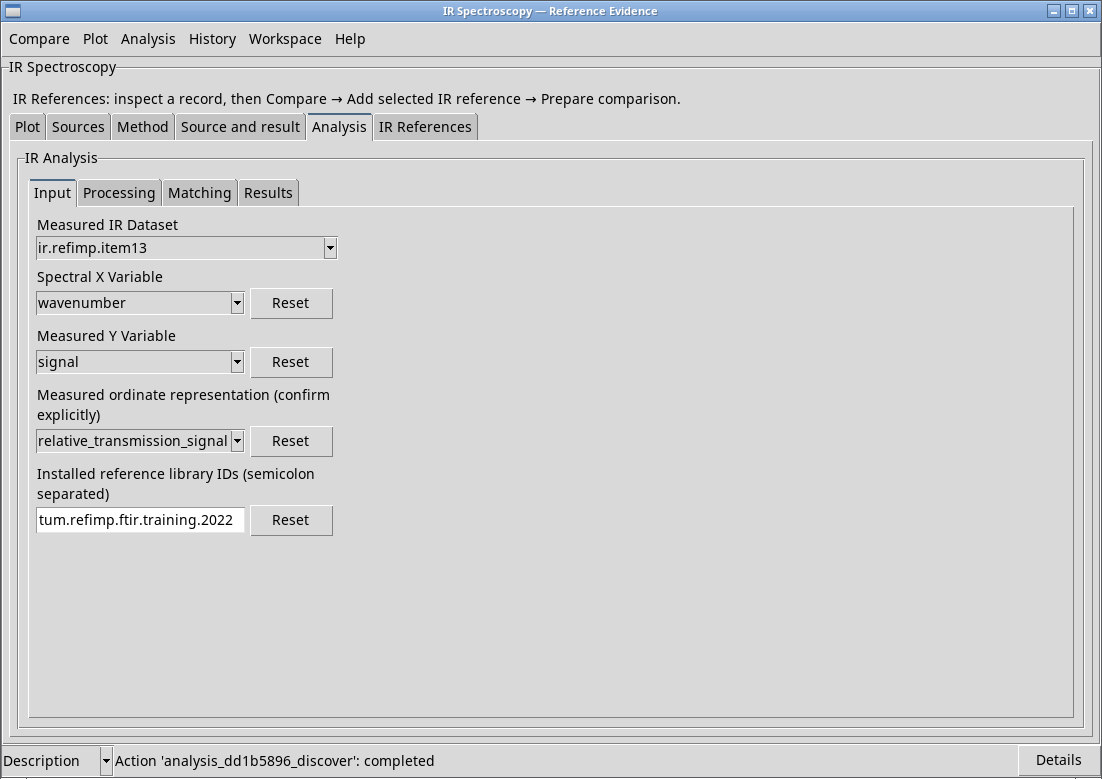
Check that the IR Analysis module is enabled. In the viewer, select Analysis → Input. Set Measured IR Dataset, use Analysis → Discover Analysis source, and choose Spectral X Variable and Measured Y Variable. For the RefIMP exercise they are ir.refimp.item13, wavenumber, and signal. The Analysis input is independent of the comparison’s Sources list.
Check Measured ordinate representation (confirm explicitly). Confirm the default absorbance only for data measured as absorbance. absorption_index is for the optical constant k and allows references of the same type. transmittance_fraction uses a fraction from 0 to 1, and transmittance_percent uses a percentage. relative_transmission_signal denotes the RefIMP relative transmission signal. Your choice affects transformations and comparability. Check the measurement metadata.
In Installed reference library IDs (semicolon separated), enter one or more managed library IDs separated by ;. The default is tum.refimp.ftir.2022. For the full corpus, use tum.refimp.ftir.training.2022. For an experiment on k, use a Library of optical extinction coefficients such as NIST/PNNL.
Set the range and preprocess the data
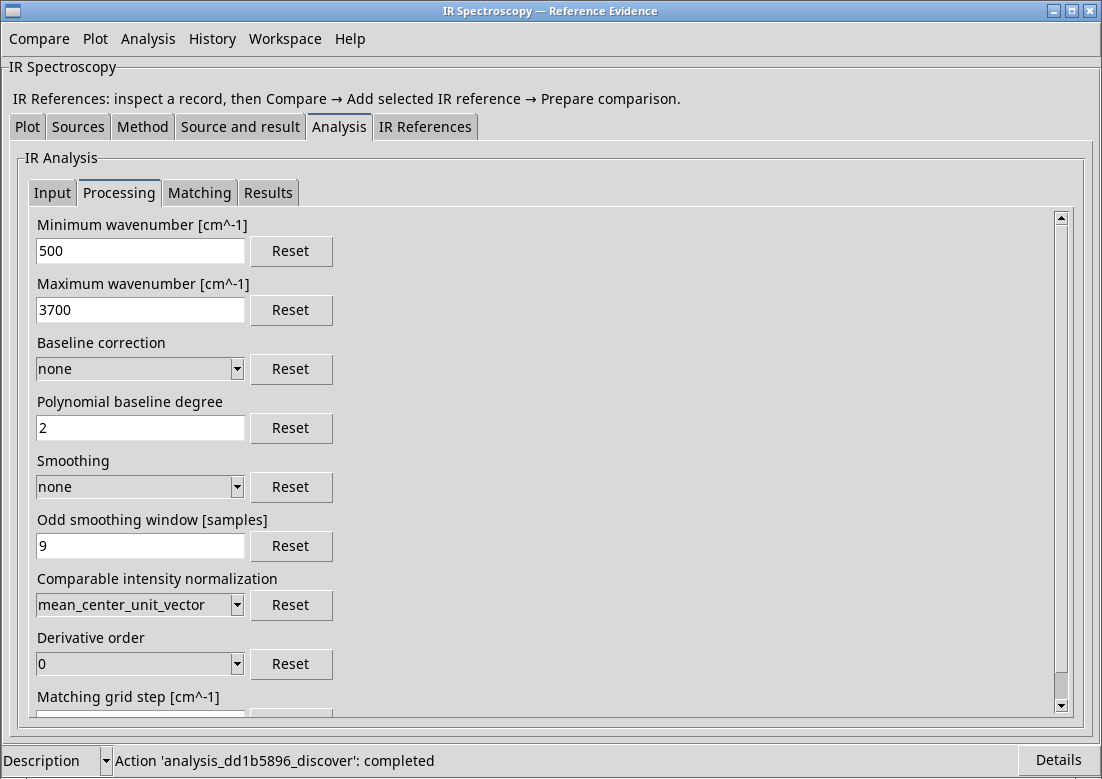
- Minimum / Maximum wavenumber [cm⁻¹]
- These fields set the requested range, initially 500–3700 cm⁻¹. The effective range depends on where the available data overlap. Check it in the results.
- Baseline correction
noneleaves the baseline unchanged,linearsubtracts a linear trend, andpolynomialuses a polynomial of the degree set in Polynomial baseline degree, initially 2.- Smoothing
noneleaves the samples unfiltered.moving_meanaverages neighboring samples,local_polynomialestimates with local polynomials, andsavitzky_golayapplies Savitzky–Golay smoothing. Odd smoothing window [samples] sets the odd window width, initially 9 samples. Choose a window appropriate for the width of the bands you want to retain.- Comparable intensity normalization
unit_vectorscales the vector to unit norm. The default,mean_center_unit_vector, subtracts the mean and then scales to unit norm. This setting changes the data used for matching. Display normalization affects only the plot.- Derivative order
0keeps the preprocessed signal.1uses the first derivative, and2uses the second. Compatible reference spectra undergo the same preprocessing.- Matching grid step [cm⁻¹]
- Spacing of the grid used for matching. The default is 4 cm⁻¹. A smaller step increases the number of points evaluated.
The Reset buttons restore the default for their respective fields. The RefIMP exercise uses none for both baseline correction and smoothing, derivative order 0, mean_center_unit_vector, and a step of 4 cm⁻¹.
Configure the ranking and fingerprint band
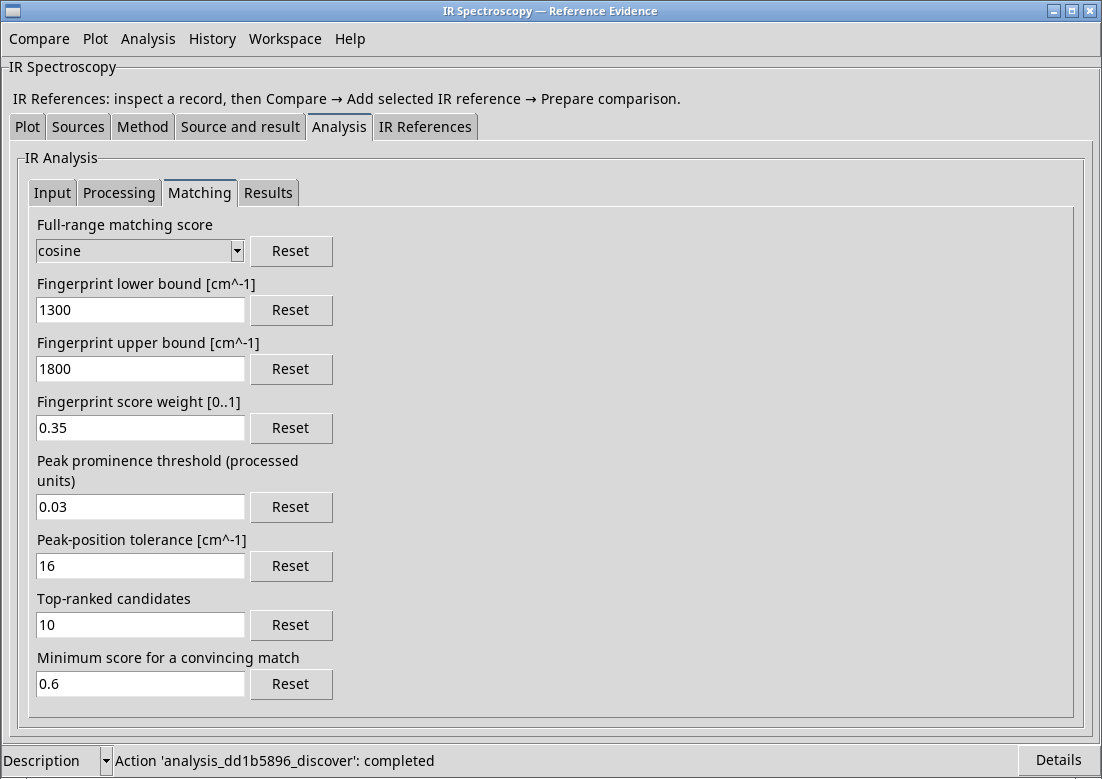
- Full-range matching score
cosineuses the cosine between vectors,pearsonuses correlation,spectral_angleuses spectral angle similarity, andnormalized_residualuses similarity based on normalized residuals. The default iscosine.- Fingerprint lower / upper bound [cm⁻¹]
- These bounds define the region that receives a separate weight. The default is 500–1500 cm⁻¹.
- Fingerprint score weight [0..1]
- Weight between 0 and 1. The suggested value is 0.35. For ItemID 13, use 1300–1800 cm⁻¹ and a weight of 0.35.
- Peak prominence threshold (processed units)
- Minimum prominence for identifying a peak in the processed signal. Start at 0.03.
- Peak-position tolerance [cm⁻¹]
- Maximum distance allowed when matching peak positions. Start at 16 cm⁻¹.
- Top-ranked candidates
- Maximum number of candidates returned, initially 10. The list can contain fewer rows. The report identifies the corpus and the rows examined.
- Minimum score for a convincing match
- The default threshold is 0.6. The report compares it with the top candidate’s score to determine the match status. Interpret the result in light of the data, material, representation, and spectral range.
Run the Analysis and read the results
Use Analysis → Run Analysis. Analysis status reads the state of the current Analysis invocation in the viewer. Cancel owned Analysis applies to the request launched from that context. Reading the status does not start a calculation.
The published outputs include the processed spectrum, peak positions, candidates, and the associated comparison. Read the session’s Results or the ir_analysis_report.txt file for ranges, settings, Library identity, coverage, and warnings. In the RefIMP exercise, 9,537 references were screened, 30 were rescored exactly, and 10 candidates were published. The top candidate’s effective range is approximately 1253.45–3698.66 cm⁻¹. ItemID 13 was already in the corpus and ranked first as refimp-train-00013 with a score of 1.0. This demonstrates consistent retrieval of the same measurement from the corpus.
Select candidates in the viewer
Use Analysis → Read ranked references to read the available results, then select Analysis → Results. Result page (zero based) starts at 0. Each page contains 25 rows, with up to 100 results overall. Change the page and read the results again when needed. Scroll horizontally to see identity, version, hash, material, scores, range, and warnings. In Selected candidate rank, choose an existing rank. Add selected ranked reference adds the exact reference to Sources if the result, Dataset, and Library still agree. Use Prepare comparison to generate the plot.