Navigate and format the plot
Axes, styling, cursor, image export, and plot variants.
Navigate the prepared plot
In Plot, Fit fits the result to the view. Zoom in and Zoom out change the visible range. Use dragging and the mouse wheel in the plot area when available. In top_bottom, the panels share the X axis. Reverse X reverses the displayed axis direction while preserving the canonical data order.
Pick display value enables the cursor. Click the trace or panel you want to read. The cursor reports values in the displayed representation. Verify the corresponding canonical row in the Dataset. Use Clear cursor to hide the marker. View controls are disabled until you prepare a comparison. Load Plot Variant… remains available whenever the current context supports loading a variant.
Edit titles, axes, and tick marks
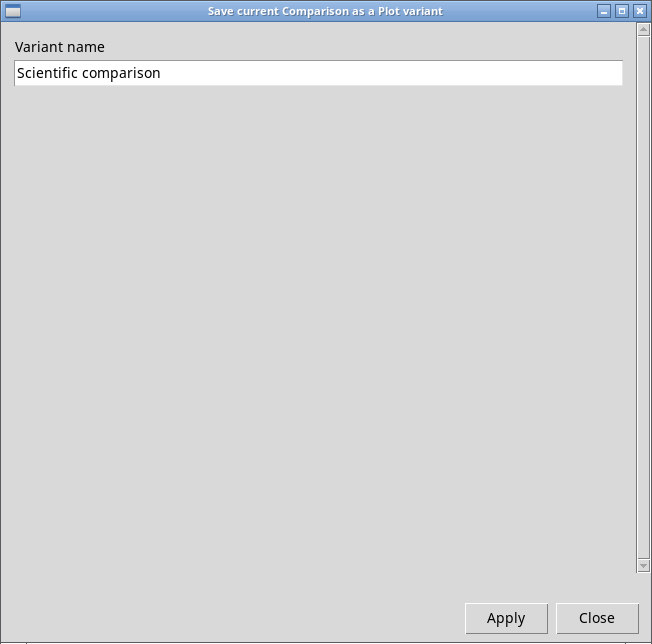
Open Plot → Properties…. In top_bottom, Y panel / panel title selects the panel by position (source_0, source_1, and others if present). Panel title changes the title for that panel. The source identity is still available in Sources.
- Shared X title / Selected Y title
- Enter the axis labels using the units declared by the Dataset or Library.
- Shared X scale / Selected Y scale
autoleaves the choice to the plot,linearuses linear increments, andlogrequires positive axis values. Check that requirement before applying a logarithmic scale.- Shared X minimum / maximum and Selected Y minimum / maximum
- Use
autoor enter numerical limits with the minimum below the maximum. X applies to all panels, and Y applies to the selected panel. - Shared X direction
autouses the default direction,normalshows values increasing from left to right, andreverseshows them decreasing.- Shared X major tick step
- Set the spacing of the major ticks. Leave it blank for automatic ticks. Shared X minor grid uses
offorautofor minor tick divisions. - Explicit X tick values / Explicit X tick labels
- Use
;as the list separator. A label can be supplied for each value at the corresponding position. Leave these fields blank for automatic behavior. - Tick font / Axis-label font / Title font
- Sizes are in pixels. Leave a field blank to inherit its size. The tested view used 12, 14, and 18.
Apply applies the settings to the plot. Close closes the dialog.
Show the legend and distinguish series
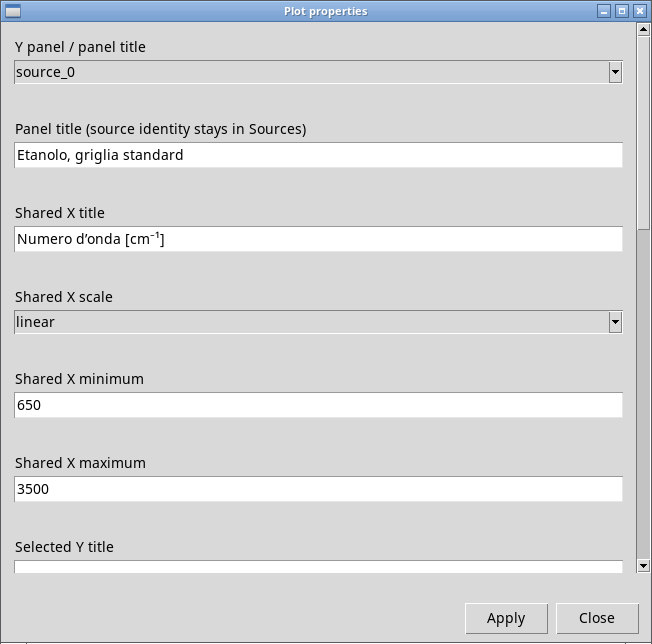
Plot → Legend toggles the legend. Series style… opens styling for an individual trace. Choose Display series (source order), for example comparison_0 for the first source.
- Color: auto or #RRGGBB
- Enter
autoor a six-digit hexadecimal color, for example#087C8F. - Line width / Line style
- The default line width is 1.5. Choose
solid,dashed,dotted,dashdot, ornone. - Marker / Marker size
nonehides markers. Available markers arecircle,square,diamond,triangle_up,triangle_down,plus,x, andstar. The default size is 4.- Opacity
- Sets transparency. At 1 the series is opaque, and at 0 it is invisible. Apply updates the series style and Close closes the dialog.
Copy the image and save a variant
Copy plot copies the current plot to the clipboard in PNG format. Export PNG… saves it to the selected path. To read the numerical data again, use the Dataset, Library, or Analysis outputs.
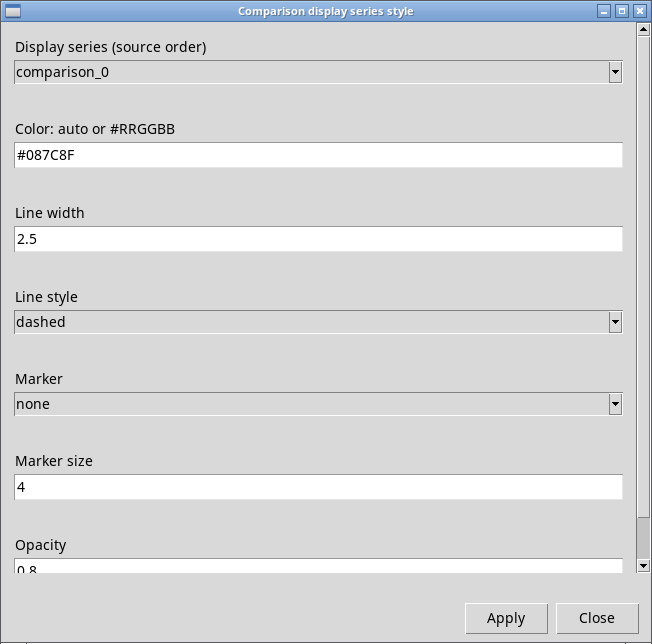
With a session open, Save Plot Variant… saves the current plot presentation and source identities. Enter Variant name and use Apply. Load Plot Variant… shows the compatible variants in the session. Select one and confirm. A variant that uses Library sources requires the exact reference to remain available.