

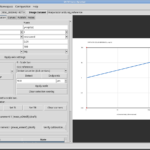
GX-TXT Curve Digitalizer — Guide 03: Digitizing Log-Log Plots
Written by Giux |
Published on Nov 3, 2026 |
No comments
How do you digitize a plot with logarithmic X and Y axes without distorting its scientific values? In Guide 03, we use GX-TXT Curve Digitalizer to calibrate a synthetic y = √x chart, trace the curve with five guide points, and publish a Dataset of 100 points. We then compare the results with the theoretical function and verify them in Dataset Preview.