

Reference — Filters, comparisons and legends
| Filter | Use |
|---|---|
| Family, Secondary family, prefix | Groups samples into members and generates labels. The ordinary family option supports auto, line, scatter, line_marker and step. |
| Ordering Variable | Changes the order in which the line is drawn. A blank field preserves source order. Break at original row gaps splits the line where the original row indices are noncontiguous. |
| Row predicate | Append, Edit selected, Replace or Clear. exact_equal/not_equal use a value; less_than/less_equal/greater_than/greater_equal a threshold; between_inclusive two ends included; in_set a literal list; is_finite/is_nonfinite no value. All conditions are in AND and use source units. |
| Exact original row ordinals | Expert list of original zero based indexes, for example 0 2 5. Raw records are data, not commands. Expert changes should be explicitly enabled. |
Apply in a nested dialog updates the proposal in the parent dialog. Select Apply there as well to commit it. The direct Advanced → Add row predicate action applies to the draft immediately. Closing or changing the parent may invalidate the nested dialog.
The comparison offers overlay, top_bottom, stacked, difference and ratio. Normalization can be none or minmax, with an offset for stacked and a denominator floor for ratio. The floor guards the calculation and carries no uncertainty information. You need two to eight enabled, compatible 2D series. For filters, row selections and fields on cells, first publish an explicit canonical subset. difference and ratio require exactly two ordered sources. Comparison aligns the data by linear interpolation over the common domain on the first source’s grid, with no extrapolation.
| Comparison field | Use, effect and conditions |
|---|---|
| Mode | overlay overlaps the series; top_bottom has them in separate panels; stacked overlaps by applying a progressive shift; difference calculates the difference of the two ordered series; ratio calculates the ratio. The last two options require exactly two sources and units compatible with the operation. |
| Explicit display normalization | none keeps the original scale. minmax explicitly normalizes the display. minmax is allowed with overlay and stacked. top_bottom, difference and ratio require none. The Dataset is unchanged. |
| Stacked display offset | Numerical step of progressive shift used by stacked to distinguish the series; zero does not add separation. |
| Ratio denominator floor | Non-negative numerical threshold that protects the division from too small denominators; it is used for ratio and is not an error bar. |
Fields in Families, order and filters…
Select a compatible series and open the dialog. Apply commits all changes together. Close discards them.
| Field | Use and effect |
|---|---|
| family variable id | Variable identifying the primary group. Leave blank for no grouping. When set, the renderer separates the supported members. |
| secondary variable id | Optional variable to further subdivide family members; choose it only if the type of series admits families. |
| Family label prefix | Prefixing of the labels generated for members; does not change the canonical identities. |
| Sort using Variable (blank keeps original order) | Choose a numeric variable to control the drawing order. A blank field preserves the original row order. |
| Break lines at gaps in original rows | When enabled, gaps in the source indices break the line between noncontiguous rows. |
| Exact original row ordinals (blank means all) | With expert editing enabled, enter original zero-based indices such as 0 2 5. A blank field includes all rows. |
| Raw predicate records (expert only) | Expert predicate definitions are Tcl data. Enable expert row-list and predicate editing before editing them. For example, {filter_variable_id scalar predicate greater_than value 300} selects rows whose scalar is greater than 300 in the source unit. Use the actual variable ID. Multiple records form a list and are combined with AND. Use Add/Edit if you are unfamiliar with the schema. |
If preparation reports Viewport is too small for the complete inside legend, the inside legend does not fit. Enlarge the figure, reduce font size or column count, move the legend outside or hide it, then try again. The rejected proposal has not been accepted.
Viewing a Workbench comparison
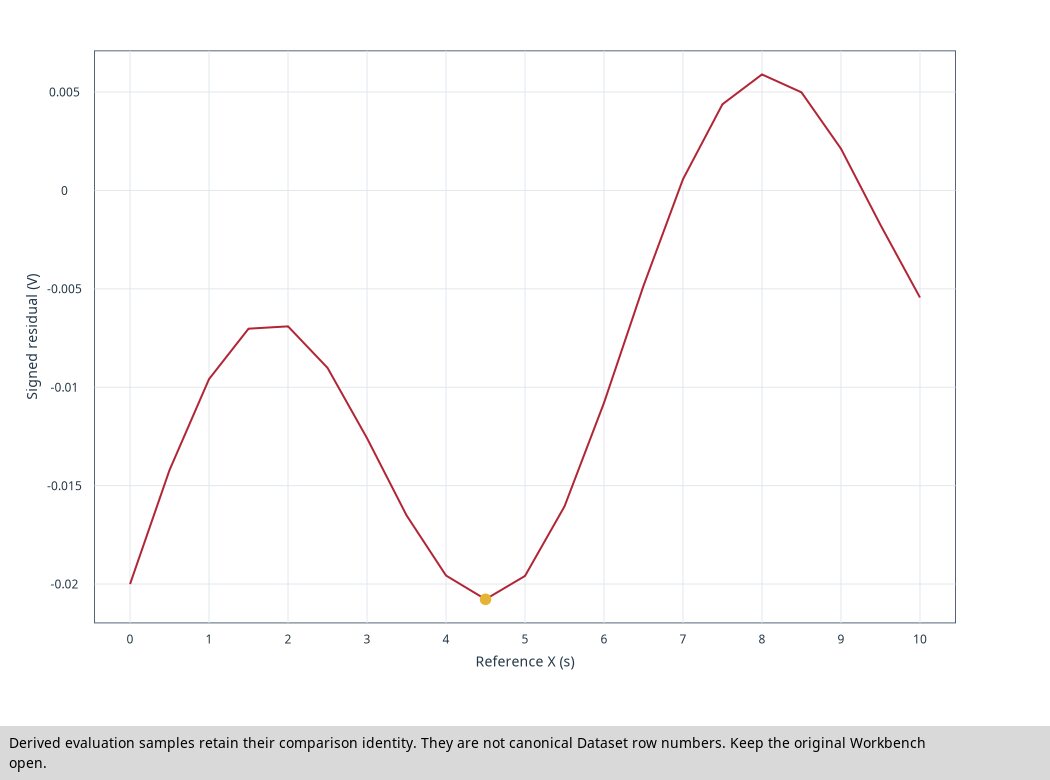
- In the open Curve Workbench, add two paths. In View → Compare / residuals, choose Reference path, Target path and the method, then select Compare.
- Leave the Workbench open. In Curve Viewer, choose Advanced → Inspect Workbench comparison…. In Original comparison owner, select the Workbench shown and click Apply.
- The window displays residuals calculated by the Workbench. Evaluation samples belong to the comparison and have their own identities. If the data or comparison changes, recalculate in the Workbench and reopen this view.
Legend
Placement options are inside, below, above, left, right, manual and none. Inside anchors are northeast, northwest, southeast, southwest, north, south, east, west and center. Layout supports auto, row, stacked and wrapped. Set a positive column count, font in px or pt, alignment to start, center or end, and margin in pixels. Manual X/Y are percentages of the full canvas. Background and border can be explicit, transparent or inherited, depending on the control. A hidden legend or disabled border may show no effective color. In 2D, dragging the rendered legend records one History step. Undo restores its position. The coordinates apply to the setting shared by the panels.