

GX-TXT Debugger · Guide 06 — Debugging a complete scientific workflow
This guide is part of the project GX-TXT Script Debugger. The screens come from real executions in GX-TXT dev112-P011-bis, already made for the debugger course; examples use synthetic data. The D codes identify the corresponding exercises of the full course on the debugger.
Download the six practical guides’ scripts (ZIP). To repeat this guide, extract the guide_06/scripts folder files.
D40 — Transformations and units
A numerical value can be correctly calculated and misinterpreted if we lose the unit. Before a transformation, we make explicit greatness, unity of input and unity of the result.
Follow a conversion
Use D01_temperature_fixed.m in the Test Session. The script starts from celsius = 20, adds offset = 273.15 and gets kelvin = 293.15. Put a breakpoint on the press and start the debugger.
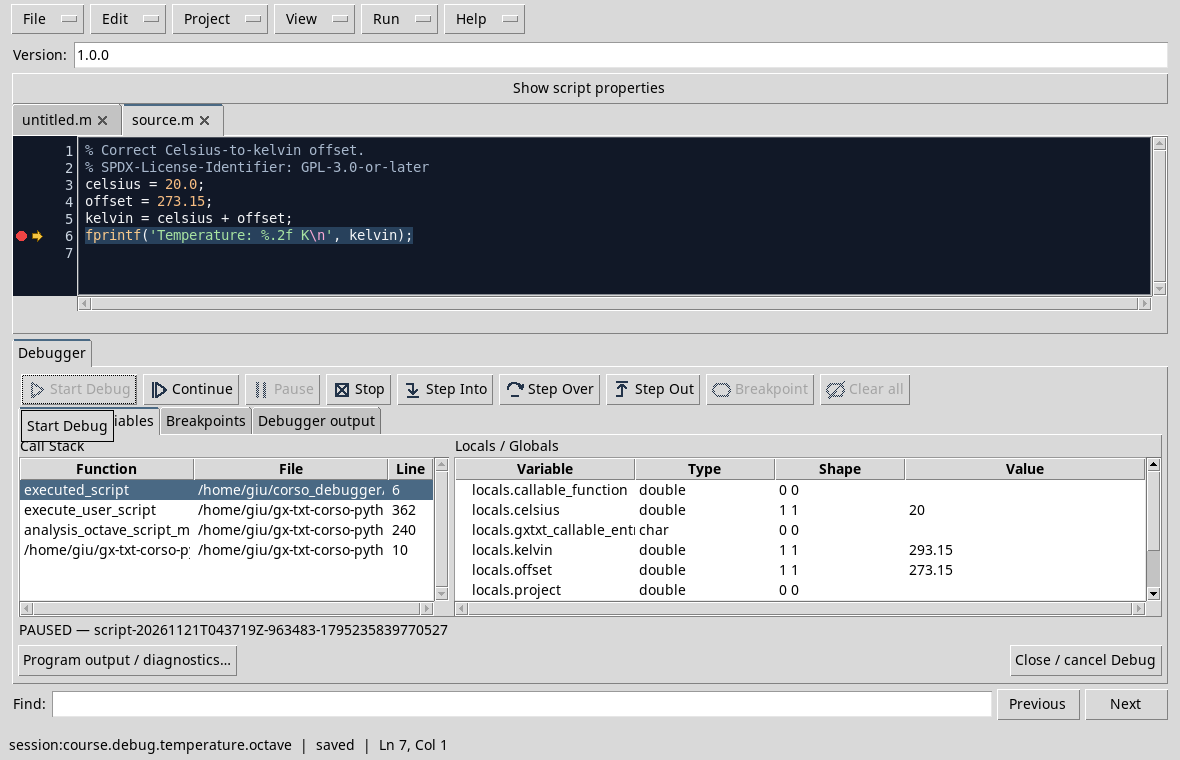
In the test the panel shows the three climbers. The 293.15 numerical value must be interpreted as kelvin because they specify the formula, the names and the print: the numerical type alone does not automatically contain this explanation.
When these values come from a Dataset, it also checks units and Variable IDs declared to the source. In the D39, time_s and voltage_v are different sizes: it is not enough for the carriers to have the same length to exchange them.
Exercise
If you interpret 20 °C like 20 K without conversion, should the program necessarily give a syntax error?
Worked solution
No. Both are valid numbers; it is the physical interpretation to be wrong. Explicit units and controls are required with independent expected values.
D53 — From Dataset to plot
A correct chart requires both correct values and the right association between sizes and axes. Before you build it, stop by reading the Dataset.
From Session to Axes
Follow the D41 to create a debug_sensor_series test session, then the D39 to read time_s and voltage_v. The data are [0, 1, 2] s and [1, 2, 3] V respectively. The Dataset is created-only: to repeat the publication choose a new session or a new ID and update it also in the reading script.
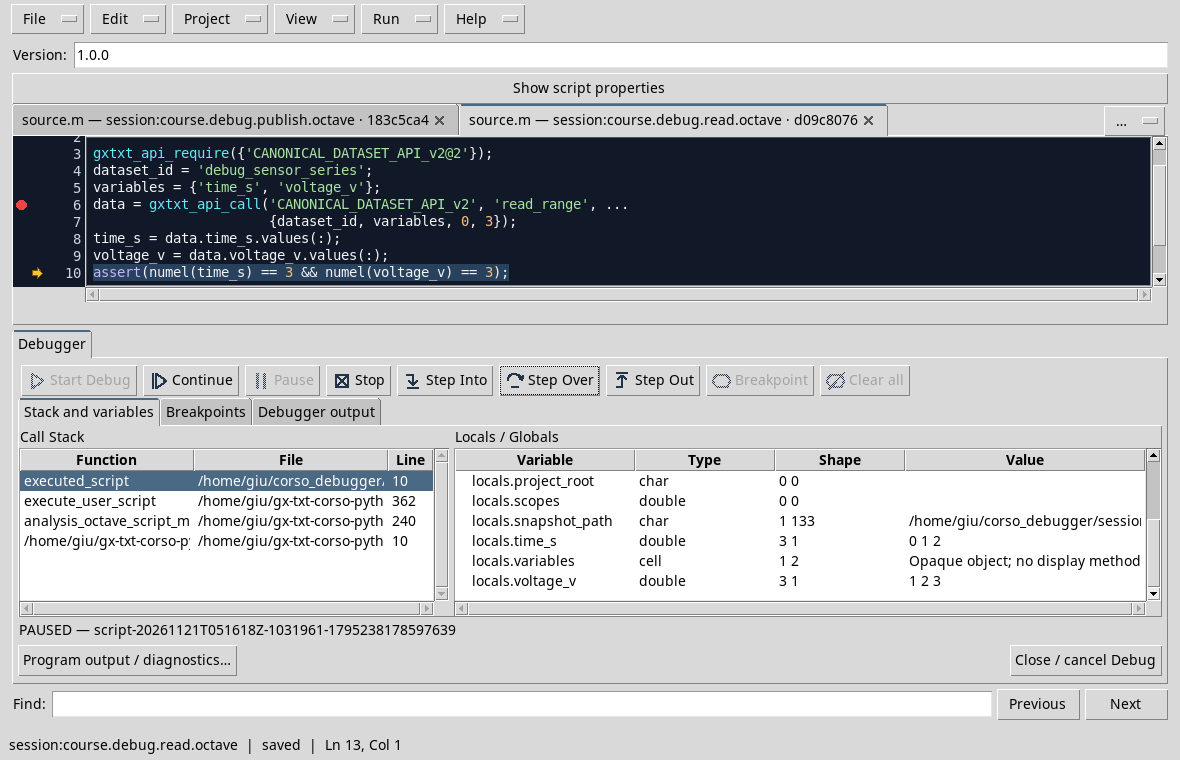
In the D39 screen, we control values and shapes after read_range. To prepare an XY chart combines time with horizontal axis and vertical tension; the expected pairs are (0, 1), (1, 2), (2, 3). Reverse the variables preserves three numerical pairs but changes the meaning of the chart. It carries units and names on the axes and checks a known point before drawing conclusions.
The D53_sensor_plot.m script builds the chart through Plot Dataset API. Import it to the same Session, save it and start the debug; after the eventual initial break, press Continue. In the test the Job is finished with COMPLETED and produced the following chart with the native renderingr. The file is the result exported by GX-TXT, not a viewer screen.
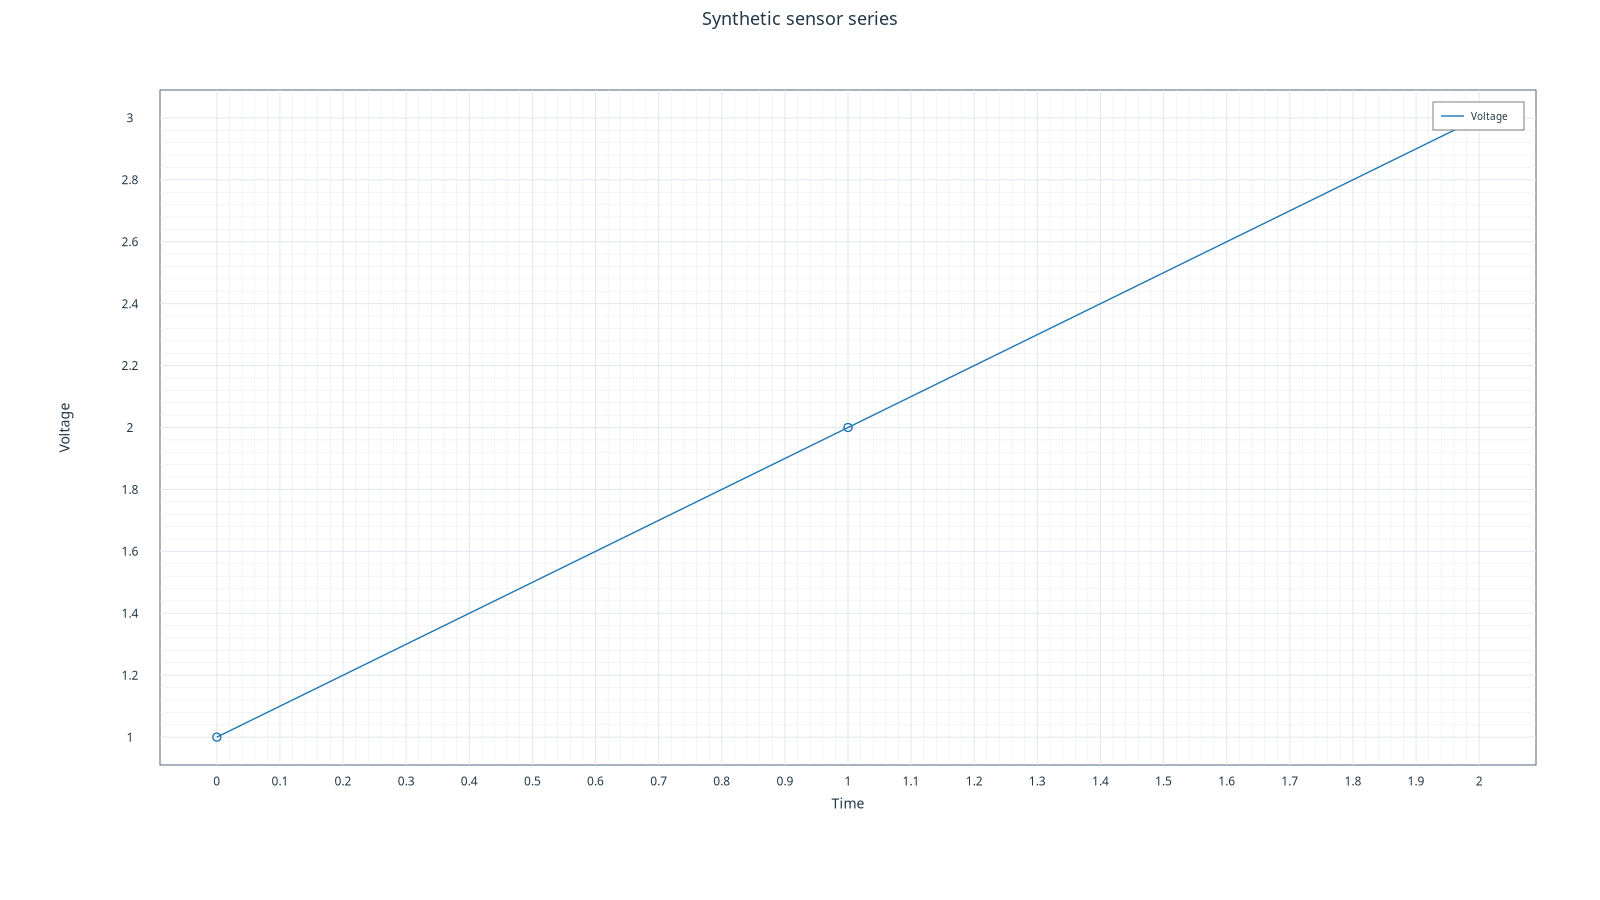
The graph uses the Time and Voltage names; in the documentation it explicitly associates the s and V units. The availability of the API and the renderr depends on the installed configuration.
Exercise
What do you get with 1 s time and 2 V voltage?
Worked solution
With time on X and voltage on Y the point is (1, 2); reverse the axes would give (2, 1) and a different interpretation.
Registration, Job and repetition
In the workflow open a trial session, save each script with a recognizable Script ID and start the Debug Job from the saved revision. The publication of the Dataset in the 05 guide is created-only: for a second test use a new Session or a separate ID and updates all the scripts that read it. Check Job status and Program output / diagnostics after each phase. Keep the revision and identity of the script that appear in the Job details: the snapshot executed is distinct from the subsequent changes in the editor.
D48 — Reproducing a diagnosis
A diagnosis is useful when another person can repeat the case and check the correction. An essential tab collects context, input, expected result, observed result and steps.
Example: incorrect index
Use D23_index_error.py. Note that the list contains 10, 20 and 30, that the call uses the 3 index and that it was intended to read the third element, i.e. 30. Record version of GX-TXT and Python, Session, Identity and Revision of the script; indicate the breakpoint on return samples[index].
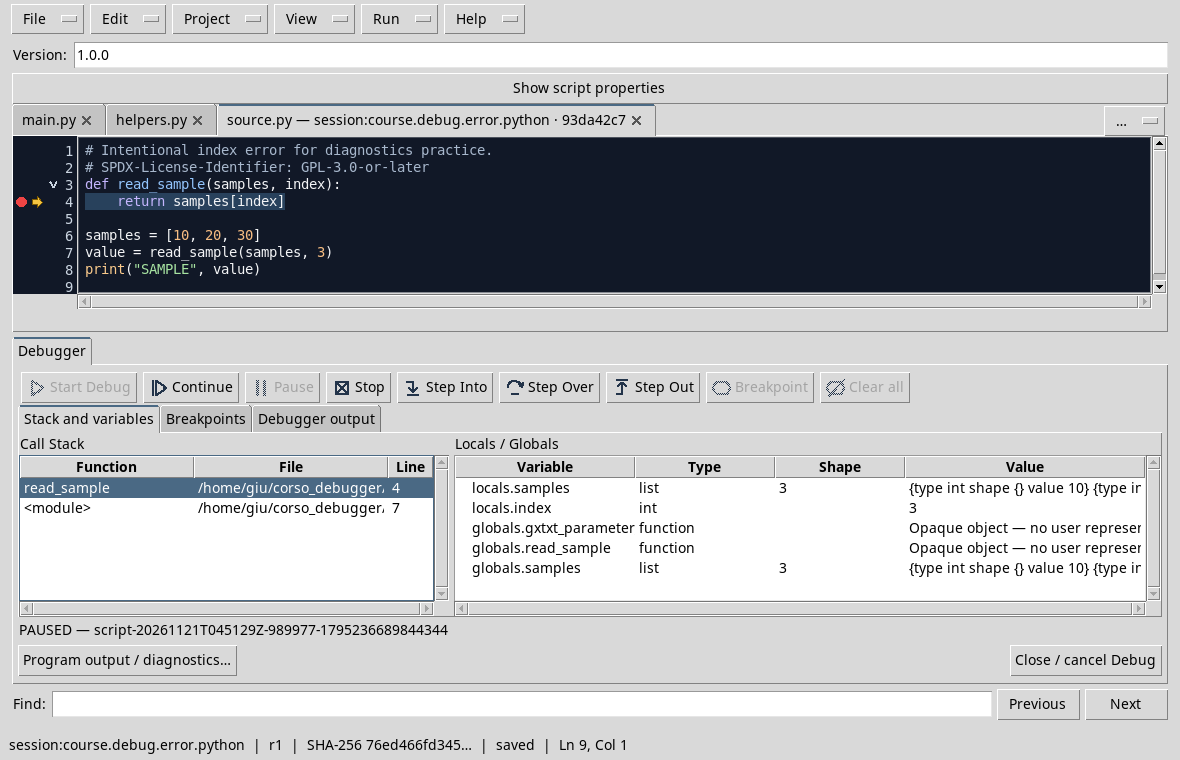
3 and 3 index are shown in the test, followed by IndexError. The D23_index_fixed.py copy uses the 2 index and produces SAMPLE 30. The card must distinguish the intentional error of the exercise from the operation of GX-TXT.
Good reproduction uses minimum data and does not include private information. It is not enough to say “it doesn’t work”: specific what to do, what to expect and what to look at.
Exercise
What two information distinguishes the symptom from the verification of correction in this case?
Worked solution
The symptom is the IndexError with 3 index; the correction verification is the 30 output with 2 index and the same data.
Other steps of this project
- Debugging GNU Octave in GX-TXT: Breakpoints, Variables and Public APIs
- GX-TXT Debugger · Module 08 — Projects, revisions and Sessions
- GX-TXT Debugger · Module 09 — Integrated practical cases
- GX-TXT Debugger · Module 10 — Independent debugging and the final project
- GX-TXT Debugger · Guide 05 — Debugging scientific data: vectors, structures and Datasets
- GX-TXT Debugger · Module 01 — Foundations and the first Debug Job