

GX-TXT Debugger · Module 01 — Foundations and the first Debug Job
The GX-TXT debugger · 10-module course
A calculation can go wrong even when the program ends without signaling errors. We start from a temperature conversion with a known result and follow the value that differs from expectations. The same test accompanies us from the preparation of the Session to the first breakpoint, until the conclusion of Debug Job.
Download the Python and GNU Octave examples (ZIP). Extract all the archive folders and keep the multifile examples files together.
D01 — Debugging as a method
A program can end without errors and still produce a wrong result. Debugging is used to understand where the difference between what we expect and what we observe is born. In this lesson we follow a small calculation with the integrated debugger of GX-TXT.
Objectives and prerequisites
You will be able to formulate an expected result, reproduce an intentional defect, stop an execution and locate a possible cause. The basics of Python or GNU Octave are needed and an open session in GX-TXT. The illustrated test uses Python Scripts in the GX-TXT dev112-P011-bis copy; the same calculation is also provided in Octave.
A result to question
To convert Celsius to kelvin sum 273,15. Then 20 °C correspond to 293,15 K. The following two examples contain an intentional error:
Both assign offset the 237,15 value and return Temperature: 257.15 K. The program is syntactically valid: the symptom is an incorrect numerical value. The hypothesis to be examined is that the problem is found in the constant conversion.
Stop before calculation in Python
- Open a Session and, in Viewers, look for Python Scripts. Open the viewer and import
temperature_bug.pyfrom the File menu. - Use the
sessionbroom, assign a Script ID and save the script. The debugger performs the recorded review: imports the file and saves the subsequent changes before a new test. - In View → Debugger, open the debug panel. In the margin next to the
kelvin = celsius + offsetline, set a breakpoint on the executable row. - Press Start Debug. If the execution stops initially before the breakpoint, press Continue to reach it. The yellow arrow indicates the selected line on pause; the red point indicates the breakpoint.
- See the row and frame values in the Locals/Globals panel. If necessary resize the panels or scroll the list: before the assignment of
kelvin,celsiusis worth 20 andoffsetis worth 237,15. With Step Over run the line and compare the value obtained with the expected one.
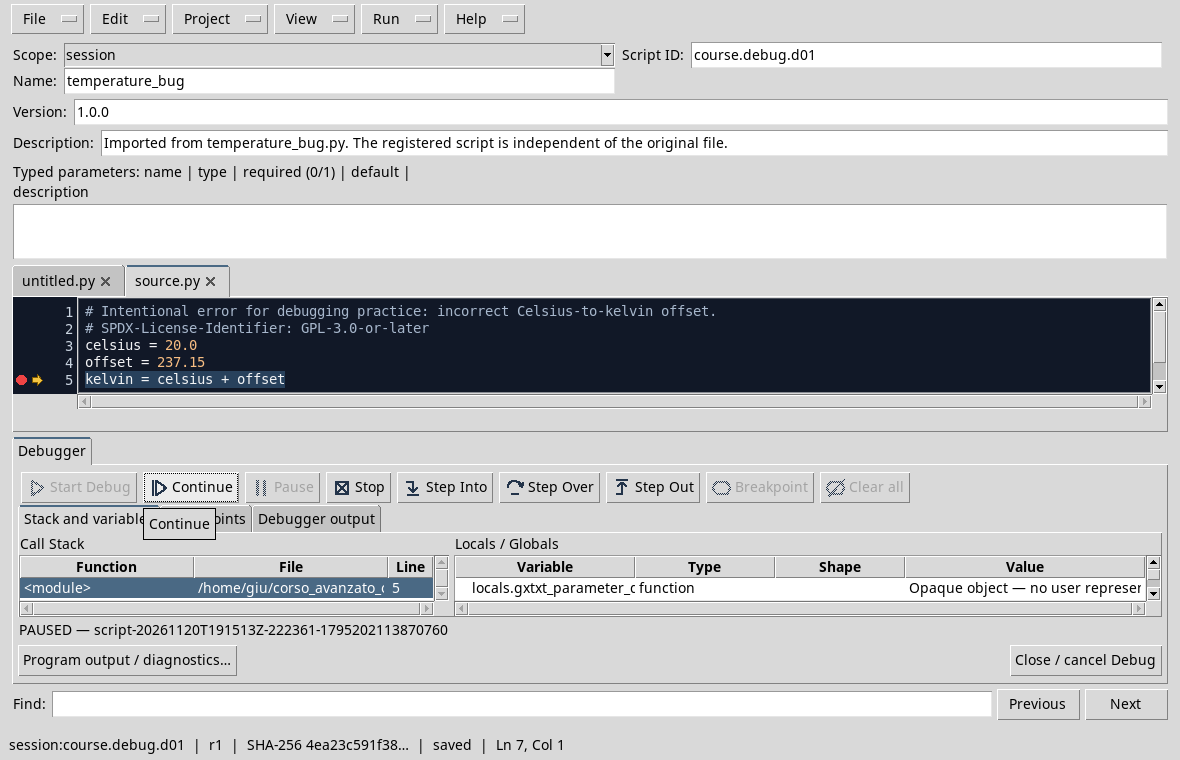
In the image you see the debugger really steady before the sum. The variable panel can only show a part of the list: scroll or increase the available space. It is not a console to change or evaluate expressions.
Correct and verify
End Debug Job with Continue or Stop. Replace 237.15 with 273.15, save and repeat control over the new revision. The correct versions are available as temperature_fixed.py and temperature_fixed.m: both must print Temperature: 293.15 K.
To repeat the reasoning in Octave, import the .m file to Octave Scripts and follow the same general sequence. The details of Octave’s specific controls will be deepened in the following modules; in particular the asynchronous Pause is not available in the Octave adaptor described by the reference version manual.
Exercise
With the correct version, what result do you expect for 0 °C? Change the initial value to a copy, save, execute and verify the result. Why didn’t the lack of error messages prove that the first version was correct?
Worked solution
0 °C correspond to 273,15 K. The first version did not violate the syntax: it simply used a wrong constant. It needed an independent expected result to recognize the defect.
D02 — Preparing the Session and Viewer
A Session collects the work we want to resume: among other things, it can contain the recorded scripts that we will use in the debugger. In this lesson we prepare a dedicated environment and import the same simple calculation in viewers Python and Octave.
Before you start
GX-TXT and the correct files of the previous lesson: ♪ and Octave. The files calculate the temperature equivalent to 20 °C: the expected result is Temperature: 293.15 K.
Create a Session
- In Configuration → Storage, check the storage profile and folder as the New Session root. If you want to keep separate exercises, create and apply a profile with a dedicated folder.
- Open the Sessions tab, then Session → New Session.
- Enter a recognizable name and select the proposed location. In the test we used
debugger_courseas an autonomous session. - Press Create and confirm the message. The Session name appears in the upper bar of GX-TXT.
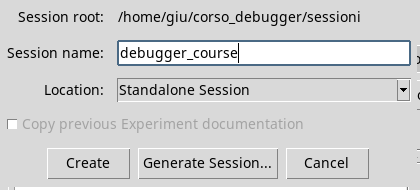
The Session folder is not necessarily the one that contains the original files: importing into the workspace script creates a managed copy in the Session. Do not edit session files directly to simulate a rescue in the editor.
Find the viewers
Open Viewers. In Scientific Scripting you will find Python Scripts, Octave Scripts and Script Library. You can filter the list with the Search field. The first two viewers allow to prepare code in their respective languages; the library helps to find the recorded scripts.
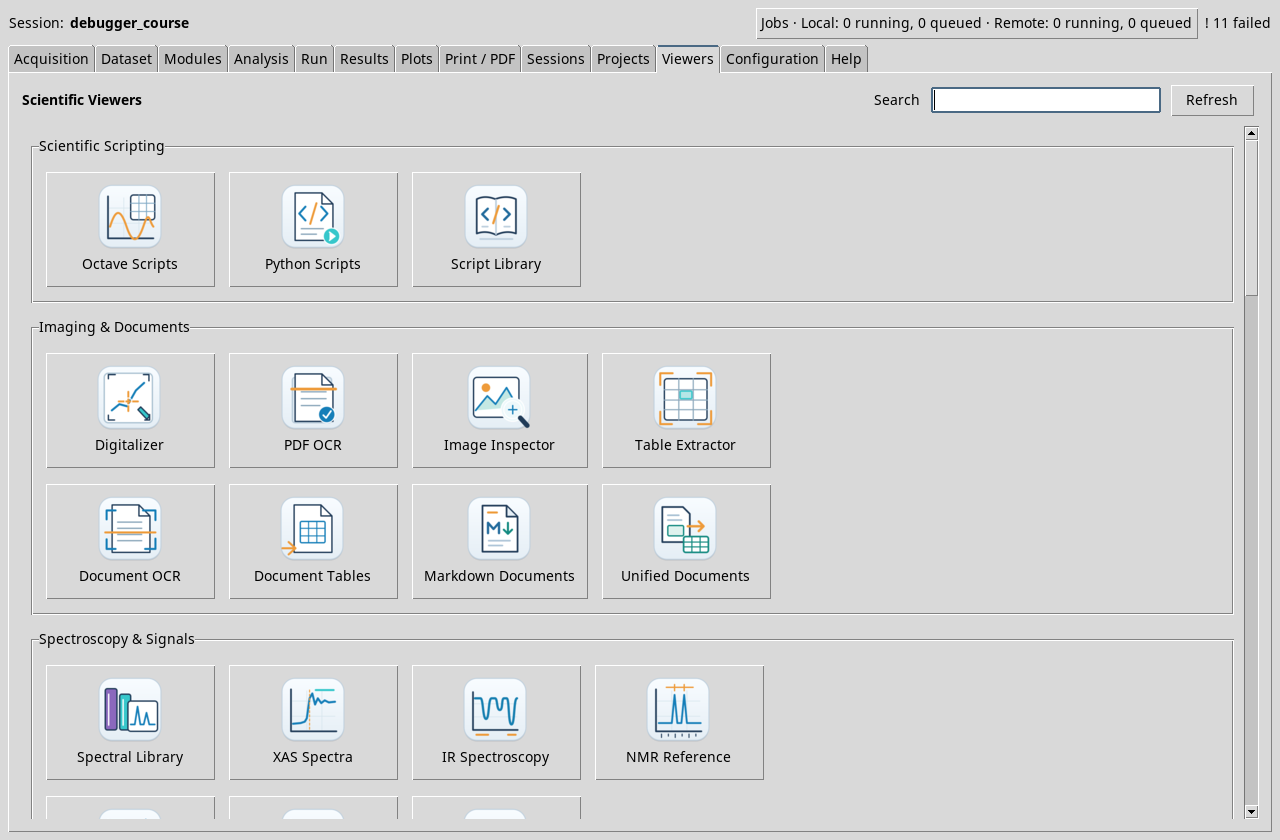
Import and record a Python script
Open Python Scripts and choose the import of a Python script from the File menu. Select temperature_fixed.py. Set the broom on session, assign a Script ID like course.debug.temperature.python and save with Ctrl+S. The bar below shows the Session identity, revision and saved status.
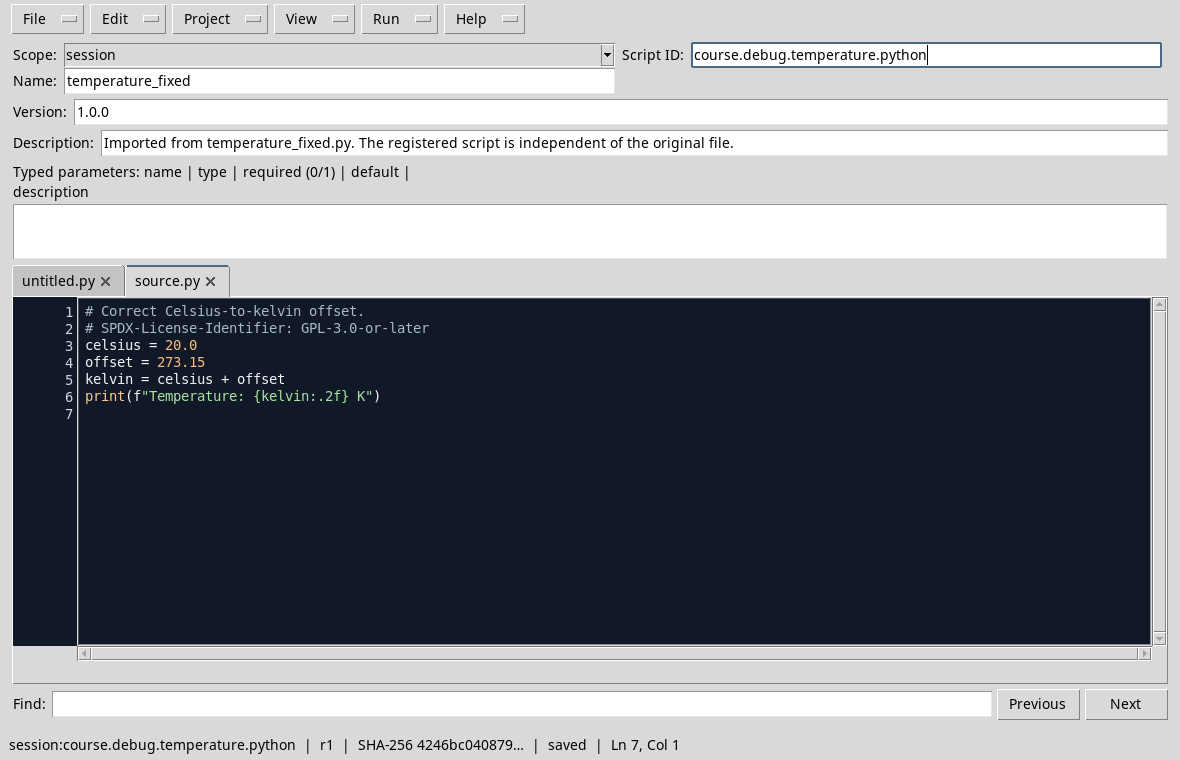
Then open Octave Scripts from the Viewers page and repeat the operation with temperature_fixed.m, using a distinct identifier, such as course.debug.temperature.octave.
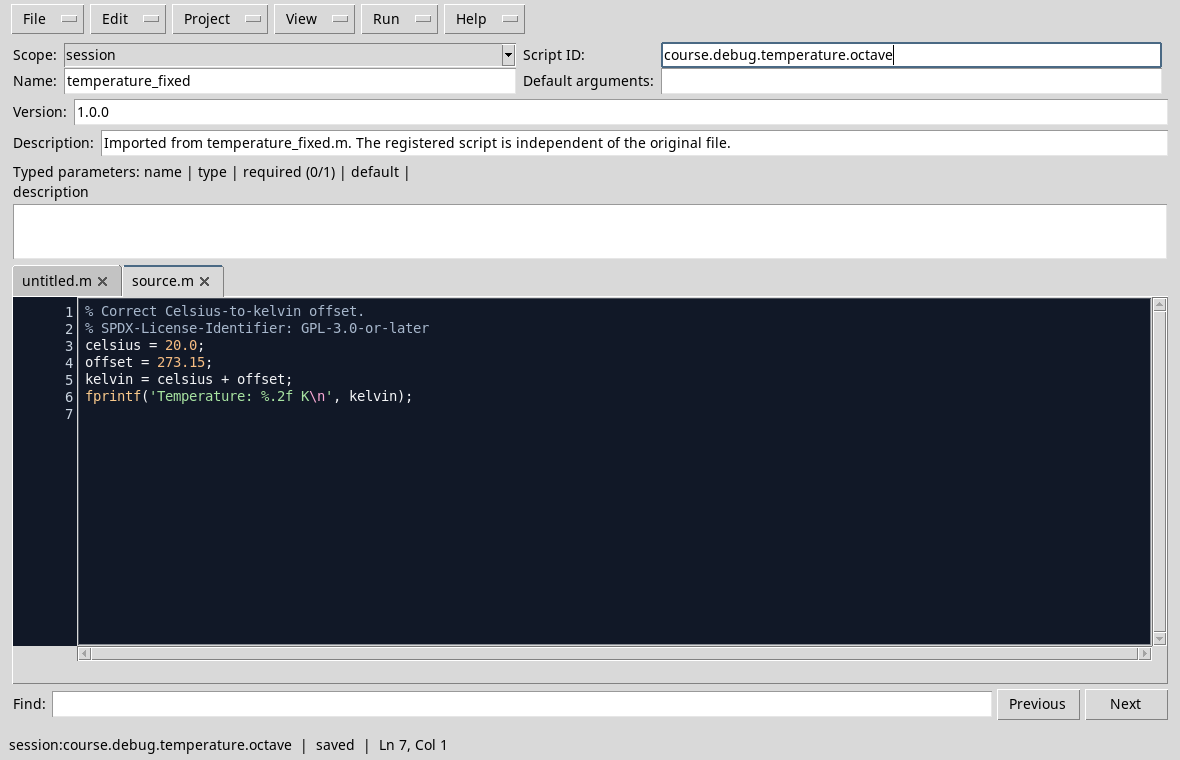
The copy shown in the editor is the copy recorded in the framework. If you change the original external file after importing, do not assume that the copy in the Session automatically changes. The next lessons show how to do it and stop it in the debugger.
Exercise
Create a trial session and import the two files with different identifiers. What control allows you to understand if you saved the copy in the intended broom?
Worked solution
Check that the broom is session and that the status bar bears the identity of the Session script and the saved status. The script names are similar, but the viewer and extension identify the language.
Course index · Previous lesson
D03 — Run and Debug: two execution paths
An ordinary execution and a debug can use the same saved script, but serve for different purposes. With Run we observe the final result; with Debug we can stop and follow the path that produces it.
Preparation
Open the lesson D02 Session and the Octave Scripts viewer. Use temperature_fixed.m, imported and saved in the session broom. The expected value is Temperature: 293.15 K.
Ordinary execution
In the viewer choose Run → Open Script Runner. The window shows the identity of the script and allows you to review parameters and inputs; this example does not require parameters or Dataset. Press Run Job and open Job details.
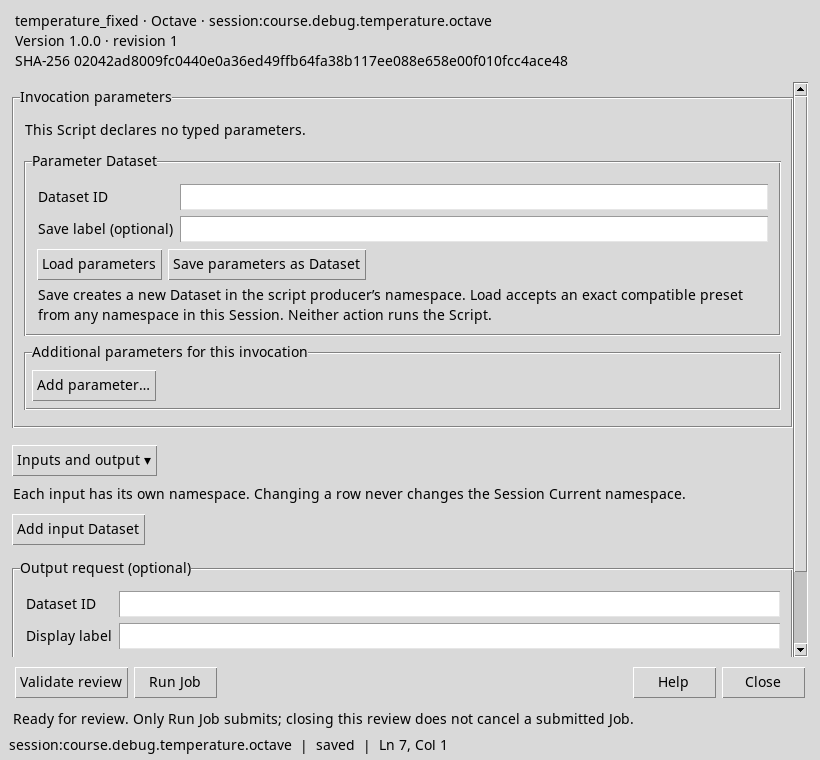
The test ended with COMPLETED and the program printed Temperature: 293.15 K:
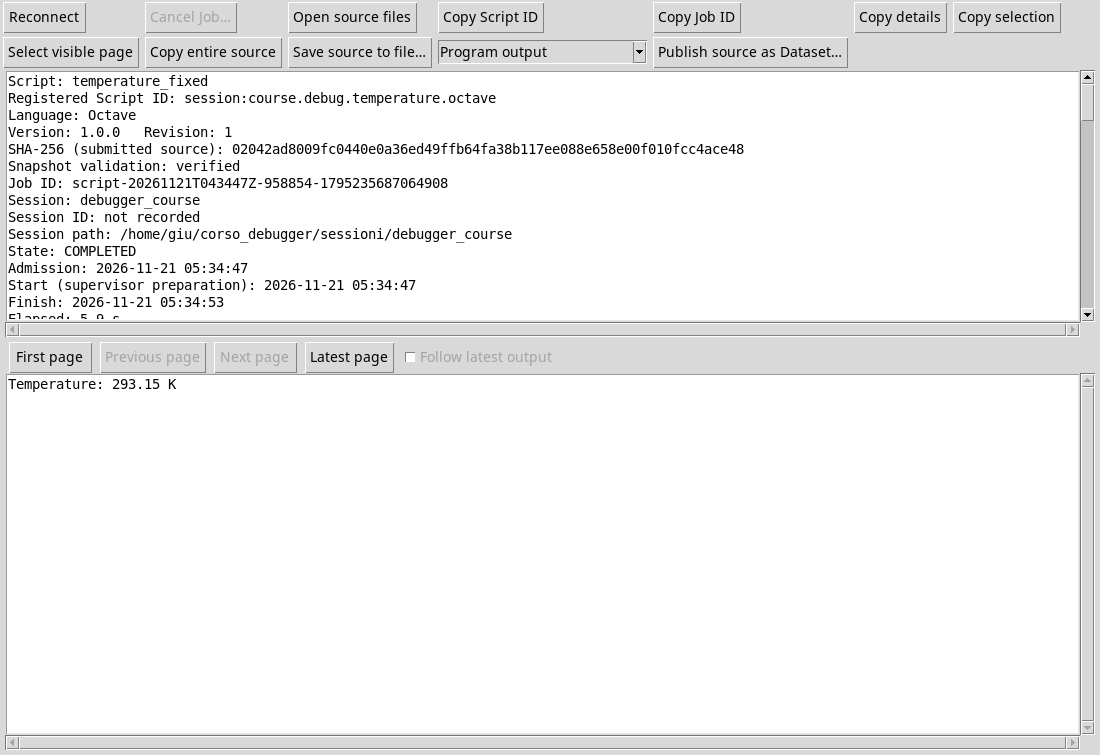
The final result allows us to verify the calculation, but does not automatically tell the intermediate values and the order in which they were obtained.
Performance with Debug
Return to the editor and open View → Debugger. Press Start Debug on the saved revision. In the test the debugger initially stopped on the first executable instruction. Press Step Over three times, waiting for each update: the arrow reaches the fprintf line, after the assignments of celsius, offset and kelvin.
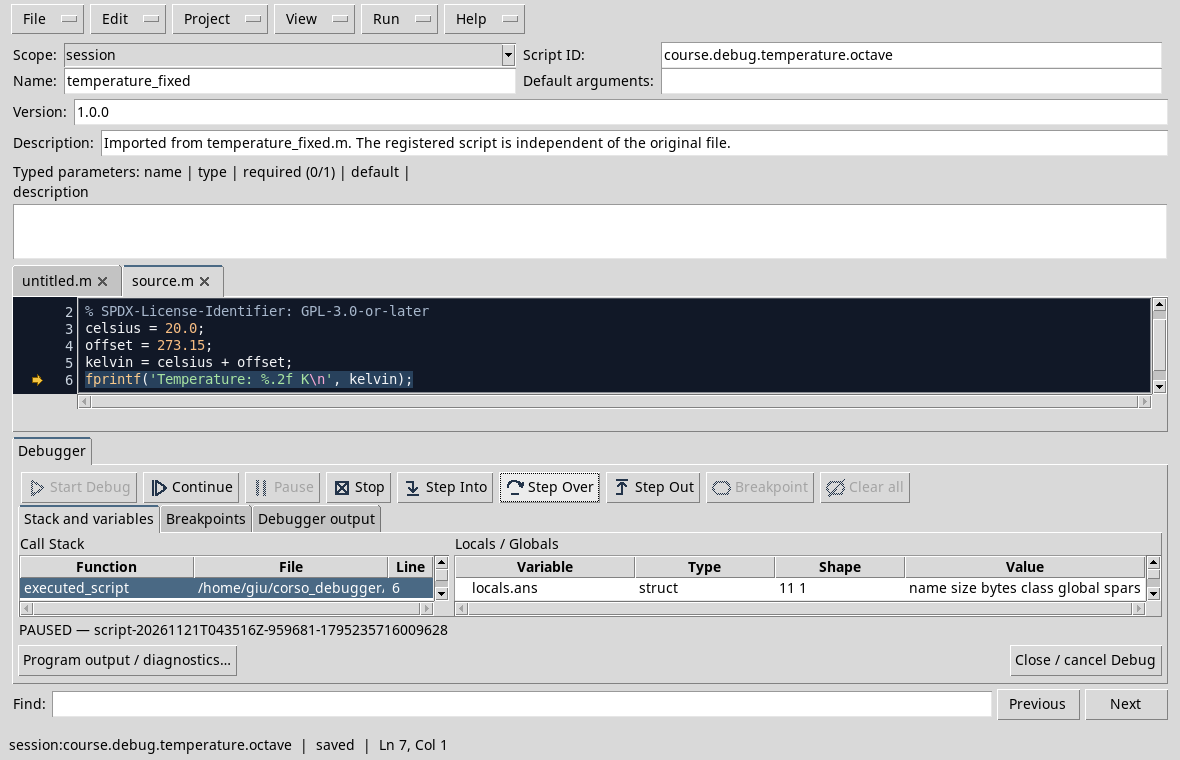
While the program is on break you can examine stacks and variables. The highlighted line indicates the point from which it will resume execution: before printing, kelvin has already been calculated. If the list of variables is small, scroll or resize the panels. Press Continue and open Program output / diagnostics to see the result of the execution in debug.
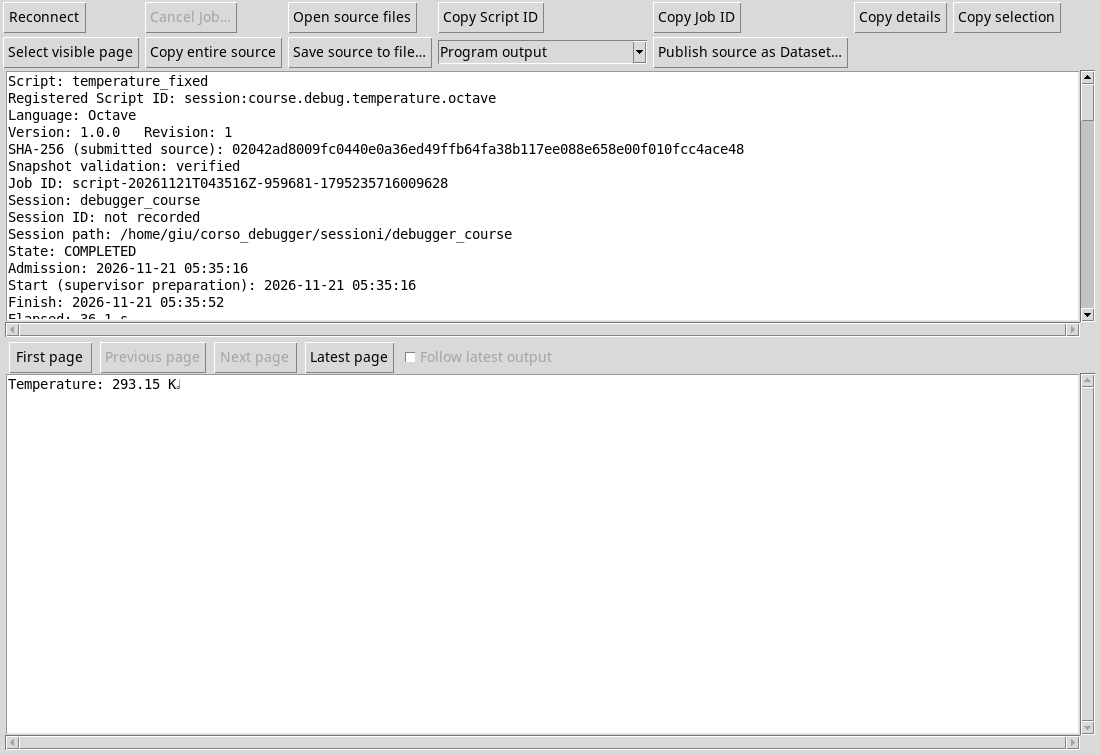
Here too the result is 293,15 K. The text produced by the program should be searched in the details of the Job; Debugger output instead contains communications of the debug controls. The general procedure also applies to Python Scripts, using the corresponding .py file of the D02.
Exercise
Repeat the test with celsius = 0.0 on a copy of the script: what value should it appear? What adds Debug to the final output only?
Worked solution
The expected result is 273.15 K. Debug allows you to stop and observe assignments and context before printing; the only ordinary execution shows the result once produced.
Course index · Previous lesson
D04 — The first breakpoint and pause
A breakpoint asks the debugger to stop the program at a precise point. It is useful when we know the area to observe and we do not want to follow all the previous instructions one by one.
Preparation
Open the Session and saved copy of temperature_fixed.m prepared in D02. The calculation must produce 293,15 K. The illustrated procedure was tested in Octave Scripts with GX-TXT dev112-P011-bis.
Stop at the press
- Open View → Debugger and verify that a Debug Job is not already active.
- Locate the
fprintfline, which prints the result. If necessary, scroll through the source until you see it. - Click in the breakpoint lane, to the left of the line number. A full red point appears; a second click removes it. You can also place the cursor on the row and press F9.
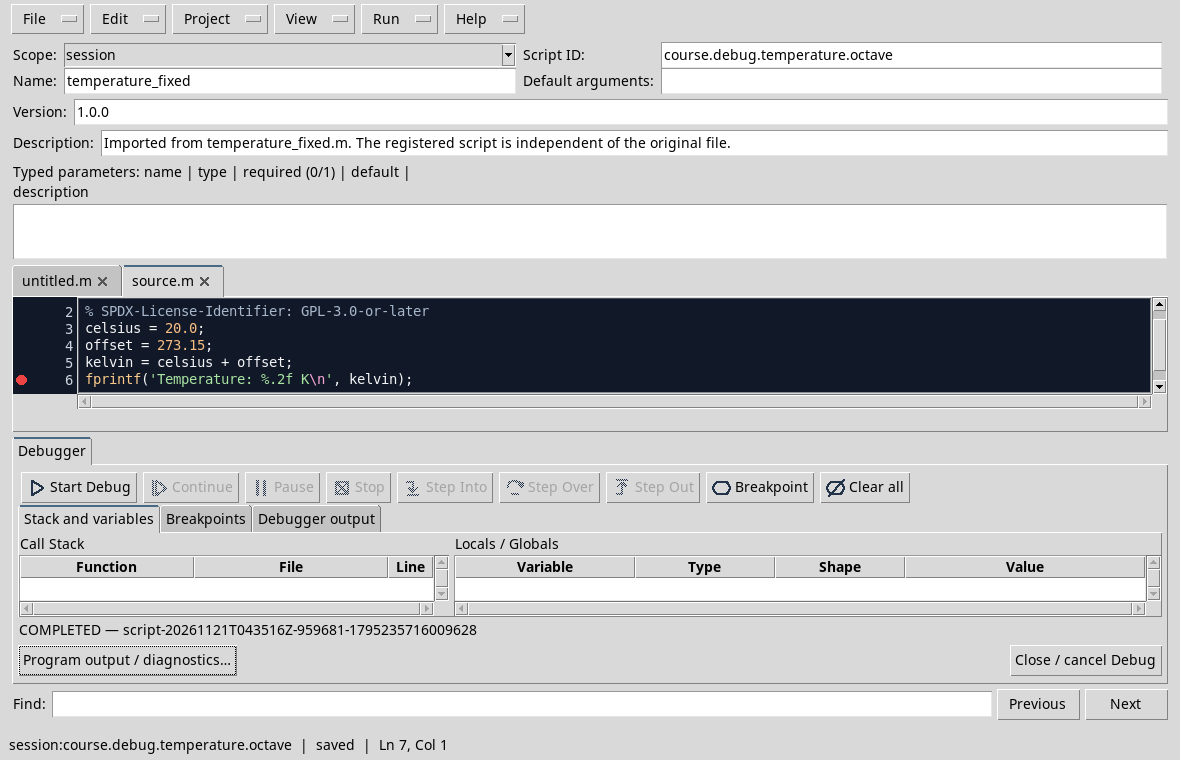
- Press Start Debug and wait for the break. In the test the debugger stopped directly on the line with the breakpoint; depending on the route there may also be an initial pause, from which you can use Continue to continue to the point set.
- Check that PAUSED, the line shown in the stack and the yellow arrow are consistent. The highlighted instruction is the next to run in the selected frame: here the value has already been calculated and the program has yet to print it.
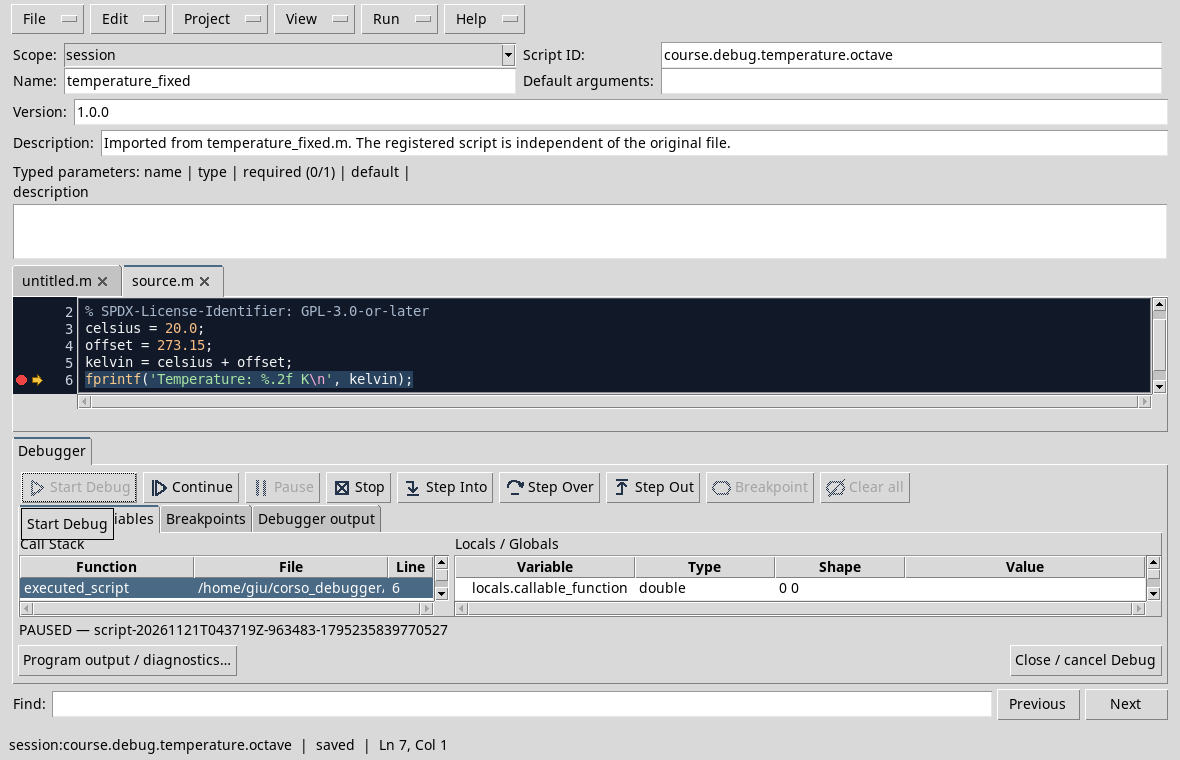
The red point indicates the required position; the yellow arrow indicates the position shown by the debugger in the selected frame. They are distinct symbols, even when they are on the same line. Press Continue to finish and compare output with 293,15 K.
Exercise
Set the breakpoint on the kelvin = celsius + offset line and repeat. What operation should still be performed when the program stops?
Worked solution
The assignment to kelvin must still be performed. The celsius and offset values have been assigned in the previous rows. The debugger shows the stop point before performing the highlighted line.
Course index · Previous lesson
D05 — Finding your way around the Debug panel
When the program is on pause, source, stack and variables tell different parts of the same state. Organizing the space makes reading easier, especially on small screens.
Open and recognize the panels
Open the Session and Octave script of lesson D04. Set the breakpoint on the print statement, open View → Debugger and start the debug. When PAUSED appears, see:
- Source: shows the yellow arrow and the selected line; the red point is the breakpoint.
- Call Stack: shows the frames, with function, file and line. Select a frame is used to examine it and does not advance the program.
- Locals / Globals: presents a summary of the selected frame variables, with type, shape and value when available.
- Breakpoints: Lists the set points and their information.
- Debugger output: collects debugger communications; the output of the program opens separately with Program output / diagnostics.
Give space to useful information
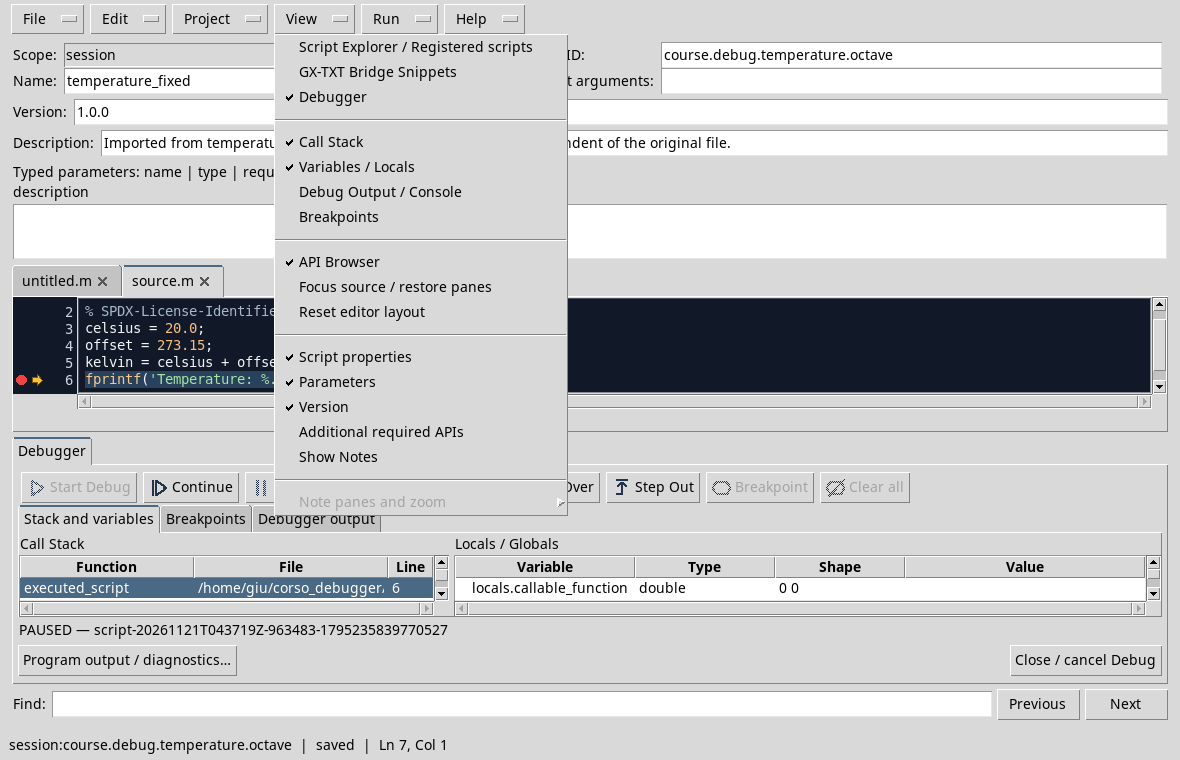
In the View menu, hide Script properties and Parameters if you don’t need proof. You can restore them from the same menu item or from the button shown in the property area. Use dragable separators to change the space assigned to the panels; you can also scroll the lists. These options change the layout, not the script values.
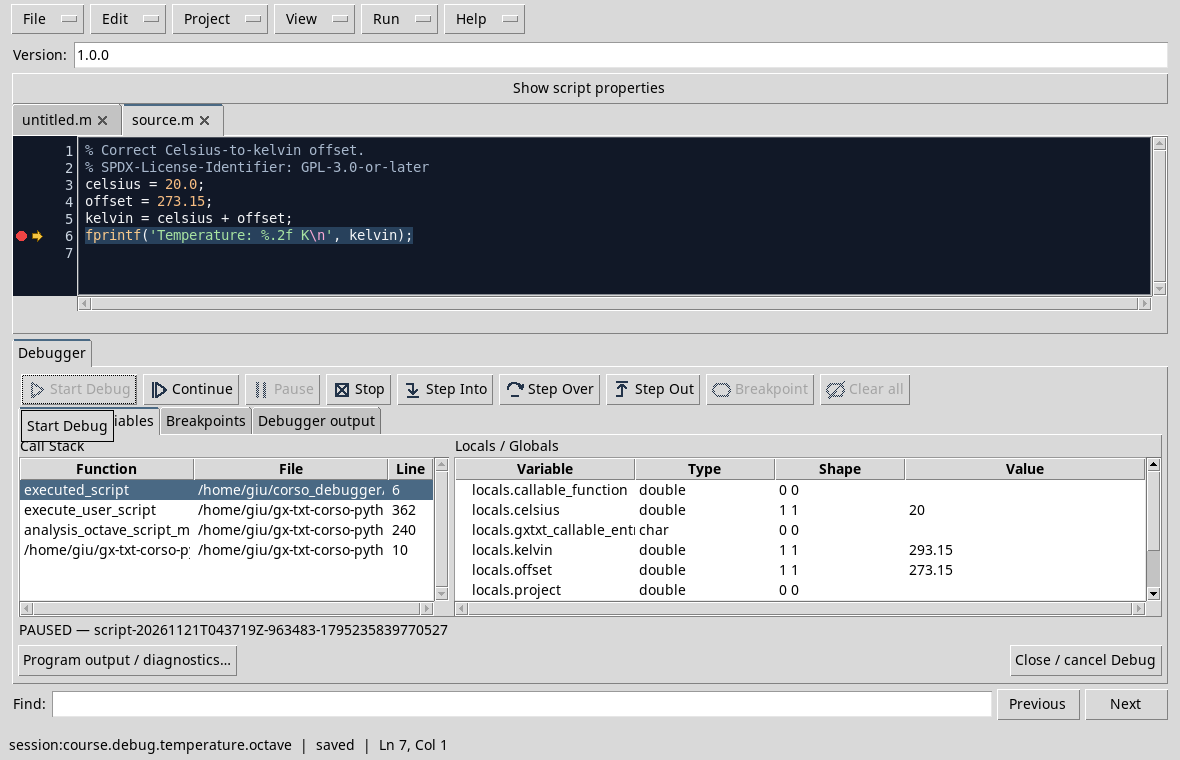
In the test the print line is paused and the panel shows celsius = 20, offset = 273.15 and kelvin = 293.15. The Shape field indicates 1 1: they are Octave climbers. Some additional rows belong to the execution environment; focus on the variables introduced by your script.
Exercise
Hide and restore Variables / Locals from the View menu. What is the difference between hiding that panel and pressing Continue?
Worked solution
Hiding the panel changes the display; Continue resumes the execution. To finish the test, press Continue or use Stop when you want to cancel it.
Course index · Previous lesson
D06 — Completing and stopping a Job
At the end of a break we can let the script arrive at the end or stop the test. The two commands have different consequences: Continue resumes execution, Stop requires the deletion of Debug Job.
Continue until the conclusion
Recapture the script Octave temperature_fixed.m in the Session prepared in D02. Set a breakpoint on the print statement, open View → Debugger and press Start Debug. When the line is paused, press Continue. If there are no other breakpoints and the program ends without errors, the panel shows COMPLETED.
Open Program output / diagnostics: the test result is Temperature: 293.15 K. At the end, arrows and active variables are removed: they are no longer a live state of the program.
Break a second test
Start a new Debug Job with the same breakpoint. When it’s on break, press Stop. In the test the panel shows CANCELLED and the stack and the variables are no longer active:
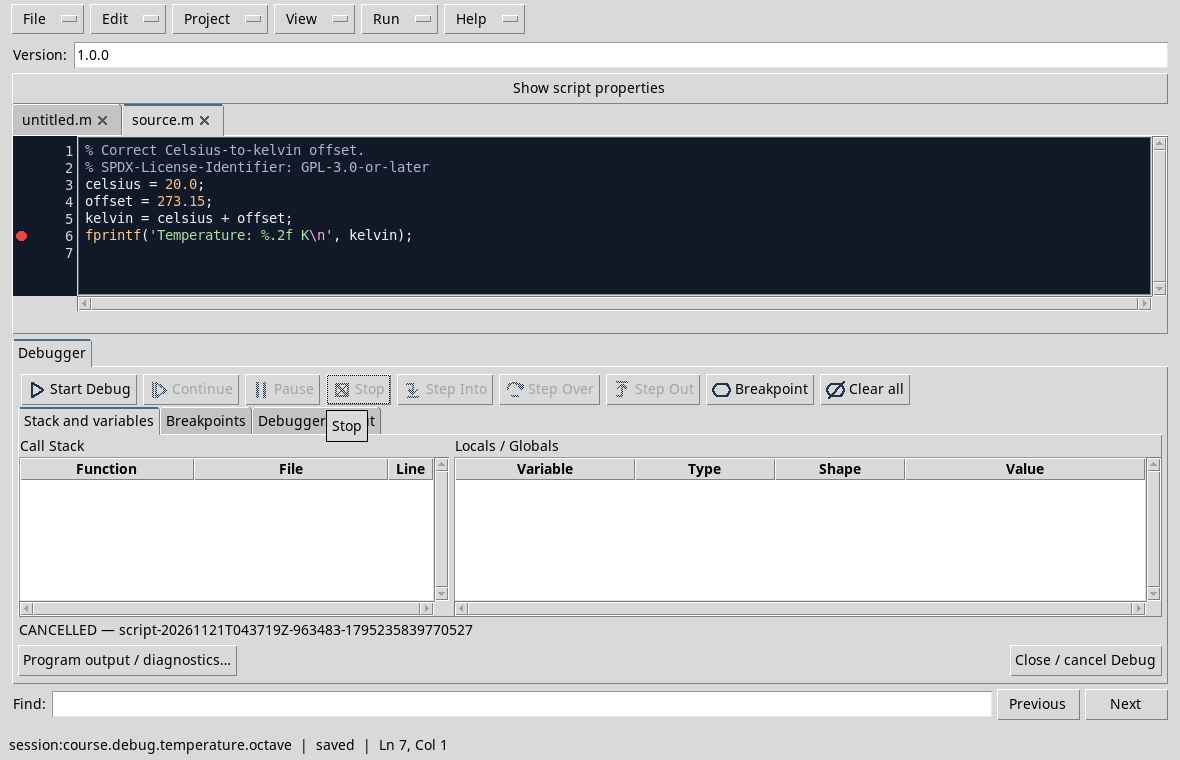
The deletion of a Job is not equivalent to a script correction and does not guarantee that the program has arrived at the print statement. The breakpoint can stay set for a next test: remove it from the lane or Clear all when the Job is not active.
Exercise
In which case is it appropriate to use Continue? And in what case Stop? After Stop can you still use the variable panel to know what the final value would be?
Worked solution
Use Continue to continue towards the end or next breakpoint. Use Stop to cancel the test when you don’t need it anymore. Once Job has been deleted, there is no living state from which to deduct the final result: to verify it, you have to perform a new test.
Course index · Previous lesson
With an expected calculation and a first observed pause, we can now accurately check where to stop and which revision belongs to the breakpoint.
Other steps of this project
- Debugging GNU Octave in GX-TXT: Breakpoints, Variables and Public APIs
- GX-TXT Debugger · Module 08 — Projects, revisions and Sessions
- GX-TXT Debugger · Module 09 — Integrated practical cases
- GX-TXT Debugger · Module 10 — Independent debugging and the final project
- GX-TXT Debugger · Guide 05 — Debugging scientific data: vectors, structures and Datasets
- GX-TXT Debugger · Guide 06 — Debugging a complete scientific workflow