

Sources and selection
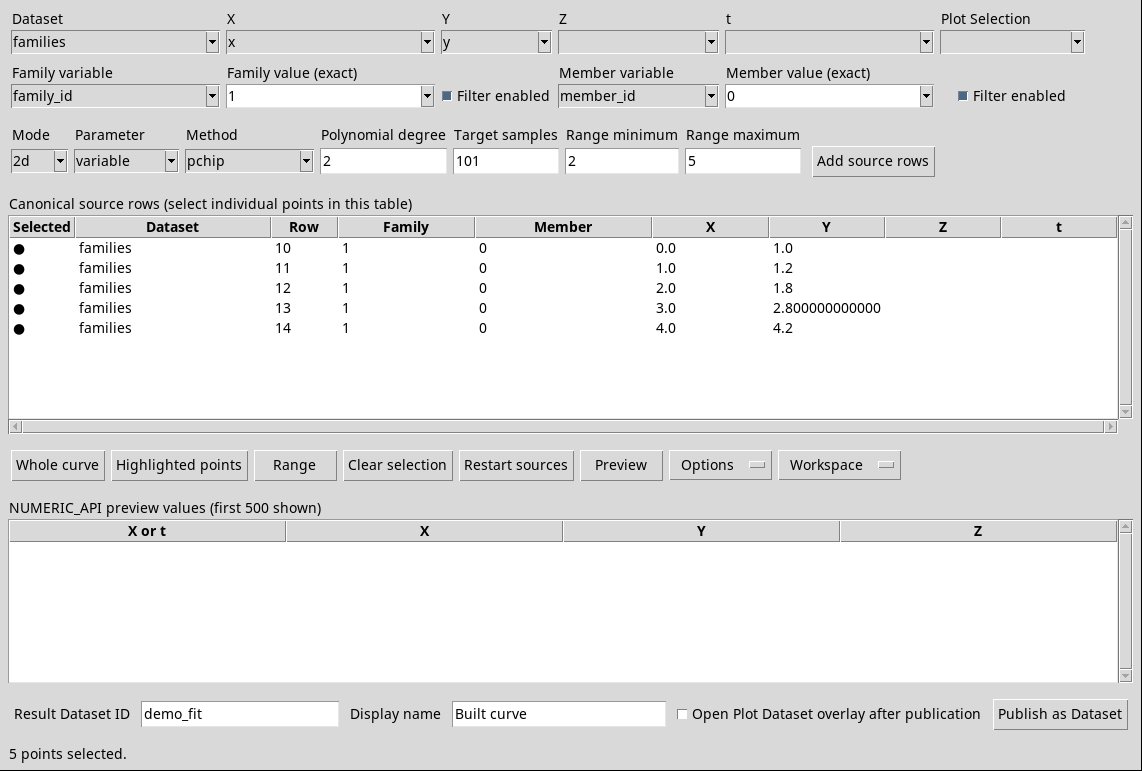
Set up a source at the top of the window and press Add source rows. You can then mark the rows you want to use in the calculation. A new addition can use different settings or Datasets.
Dataset
The Dataset menu lists Session IDs that have at least two enabled rank-one numerical variables. The first Dataset available is selected when the window opens. Changing Dataset updates the choices for axes, selections and identity. Check current field values before adding rows. If the list is empty, Add source rows asks to choose X and Y. Open or import a table with enabled numeric columns in the Session and reopen the Builder.
X, Y, Z and t
| Axis or parameter | Variable to select |
|---|---|
| X | Choose the independent coordinate for an ordinary 2D curve or the first spatial coordinate for a route. If the previous choice is incompatible with the Dataset, the Builder proposes the first available numerical variable. |
| Y | Choose the quantity to interpolate or fit in 2D, or the second coordinate of a path. If a new value is needed, Curve Builder suggests the second available numerical variable. |
| Z | In Mode = 3d, choose the third space coordinate. The field is empty. Add source rows shows Choose Z for a 3-D curve. as long as there is no choice. In 2D the field remains visible and the loading uses X and Y. |
| t | In Mode = 3d with Parameter = variable, choose the numerical variable that parameterizes the path. The field is empty. If you leave it empty, the dialog asks for a monotonic t variable or cumulative length. In 3d with arc_length the Builder derives the parameter from the coordinates. See the units and order of t. |
X, Y, Z and t show only enabled numerical variables. Check the name and units in the Session. If you combine multiple sources, the units of the same axis must coincide. Convert data to the same unit before reloading.
Plot Selection
Open Plot Selection to limit the next load to a graphical selection saved in the Session for the current Dataset. Choose the default blank entry, to consider all rows compatible with other filters. Entries with an ID represent existing selections. The choice updates the next load. The rows already in the table remain available.
- X range
- The
x_rangetype selection allows only rows in the recorded X range. Choose the same canonical X variable used to create the selection. Y can be another measure on the same Dataset. - X/Y rectangle
- A
rectangleselection requires X and Y to match the saved axes. Only rows within the bounds on both axes are included.
If uses a different canonical X variable or uses a different canonical Y variable appears, correct the axis or choose another selection. Use Range to cut out the already loaded points.
Family and Member
Use Family to distinguish families of curves and Member to identify a characteristic curve or trace within a family. The two filters work independently. The variables can also be text keys. If the schema identifies a unique variable for a role, Curve Builder can suggest it. If the role is ambiguous, choose the column that identifies the family or member before displaying the series.
Family
- Family variable
- Choose the column that identifies the family. Leave the entry blank to keep Family unassigned. Changing the variable clears its value, unchecks its filter and clears the marked points. Previously loaded rows remain in the table.
- Family value (exact)
- Choose a value from the list or type the full canonical key. To match a family with an empty key, clear the field and enable its filter. The value must match the key exactly as stored in the data.
- Family Filter enabled
- Check the box beside the Family controls to apply that value the next time you use Add source rows. The box starts unchecked. If no Family variable is selected, uncheck the box or choose a column before adding rows. Toggling this filter clears the current point selection.
Member
- Member variable
- Choose the column that identifies the member. Leave the entry blank to keep Member unassigned. Changing the column clears the Member value, turns off its filter and clears the marked points.
- Member value (exact)
- Choose or type the full member key. To match a member with an empty key, leave the field blank and enable its filter. Selecting or typing an identity value invalidates the preview and clears the marked points.
- Member Filter enabled
- Check the box next to the Member controls to require an exact match. It starts unchecked. To filter for the same member across multiple families, leave Family off and enable Member only.
Status messages
- Bounded/incomplete discovery; enter an exact canonical value
- The menu lists up to 256 values. If the key is missing from the list, type it directly.
- Canonical values … exact entry is supported
- You can type the canonical key even when the list is complete.
- No identity variable selected; filter is disabled
- Choose a column, then enable the filter.
Add source rows
Use the button to the right of the settings to add rows that pass all active filters: Plot Selection, Family and Member. Only rows with finite values on the required axes are loaded. The status message Added … canonical rows reports how many rows were added. The Selected dot stays off for each new row until you mark it. If loading takes time, use Cancel source request.
To join multiple groups, configure the next group and press Add source rows again. You can change Dataset. If you repeat the same load you can insert the same rows several times. In the calculation duplicates can generate equal independent coordinates. If The exact Family AND Member AND Plot Selection intersection contains no finite points. appears, check axes, keys and intersection. The marked points are reset and the table keeps the rows already present.
Canonical source rows
The upper table keeps the order of addition. Use vertical and horizontal bars to reach all rows and columns. Click to highlight a row, use Shift +clic for a contiguous group and Ctrl +clic to add or remove individual rows from the highlight. Then press Highlighted points to transform highlighting into markings for calculation.
| Column | Meaning |
|---|---|
| Selected | The ● pin identifies a line that feeds the preview. |
| Dataset | Source ID of that line. Check it out when you loaded multiple Datasets. |
| Row | Canonical ordinal of the original line, starting from 0. Use Dataset and Row together to find a point. |
| Family | Original key of the family associated with loading. An empty cell can indicate a blank key or an omitted variable. |
| Member | Original key of the member. Use it to check that the points belong to the expected characteristic curve. |
| X | X coordinate original, in its source unit. |
| Y | Original Y measurement or coordinate, in its source unit. |
| Z | Third coordinate if it was loaded with 3d. It is empty for 2D rows. |
| t | Parameter measured if it was loaded with 3d and variable. In arc_length the parameter calculated in the lower table after Preview appears. |
Whole curve and Highlighted points
Whole curve marks every row from all loaded sources. Check the count at the bottom before calculating. Highlighted points adds only the rows currently highlighted in the table. The marks are cumulative. Removing the highlight from a row leaves its selection dot in place. To start a new selection, use Clear selection.
Range minimum, Range maximum and Range
Write the bottom limit in Range minimum and the upper limit in Range maximum. The fields, initially empty, require finite numbers expressed in the axis unit. Range adds all points to the two ends included, using X in 2D and with arc_length, t in 3d with variable. In the latter case skips the rows without t. If the limits match, use the rows with that exact value.
If Range minimum exceeds maximum. appears, reverse or correct the two limits. An empty, textual or infinite field produces Range minimum must be a finite number. or the equivalent message for the maximum. The new range is added to the previous markings. To replace them, delete the selection first.
Clear selection and Restart sources
Clear selection removes all the selection dots, keeps the rows and cancels the valid preview and the revised order. The Selection cleared. message confirms the action. The lower table can still show the values of the previous calculation. To replace them the desired rows and recalculate with Preview. To empty both tables immediately use Restart sources, then add the data again.
Restart sources clears the entire list, markings and table of the preview values. The status bar says Source list cleared.. Choose the correct associations and add the rows again. It is the safest route if you pass between 2D and 3D or change the definition of an already loaded axis.