

GX-TXT Debugger · Module 02 — Breakpoints and source code
The GX-TXT debugger · 10-module course
A breakpoint is only useful if we know which line it represents and which revision will be performed. We learn to read the editor’s margin, manage the breakpoints and check the match between saved files and snapshots before starting a new Job.
Download the Python and GNU Octave examples (ZIP). Extract all the archive folders and keep the multifile examples files together.
D07 — The gutter and physical line numbers
The gutter is the left margin of the text in the editor. Here they share different information: the physical line number, the breakpoint position, the frame arrow in pause and, in foldable blocks, the opening and closing controls.
Read the margin
Open the temperature_fixed.m script and bring the debugger to pause on the press as in the D04. The 6 number identifies the physical line of the saved file; the full red point signals the active breakpoint and the yellow arrow signals the line of the displayed frame.
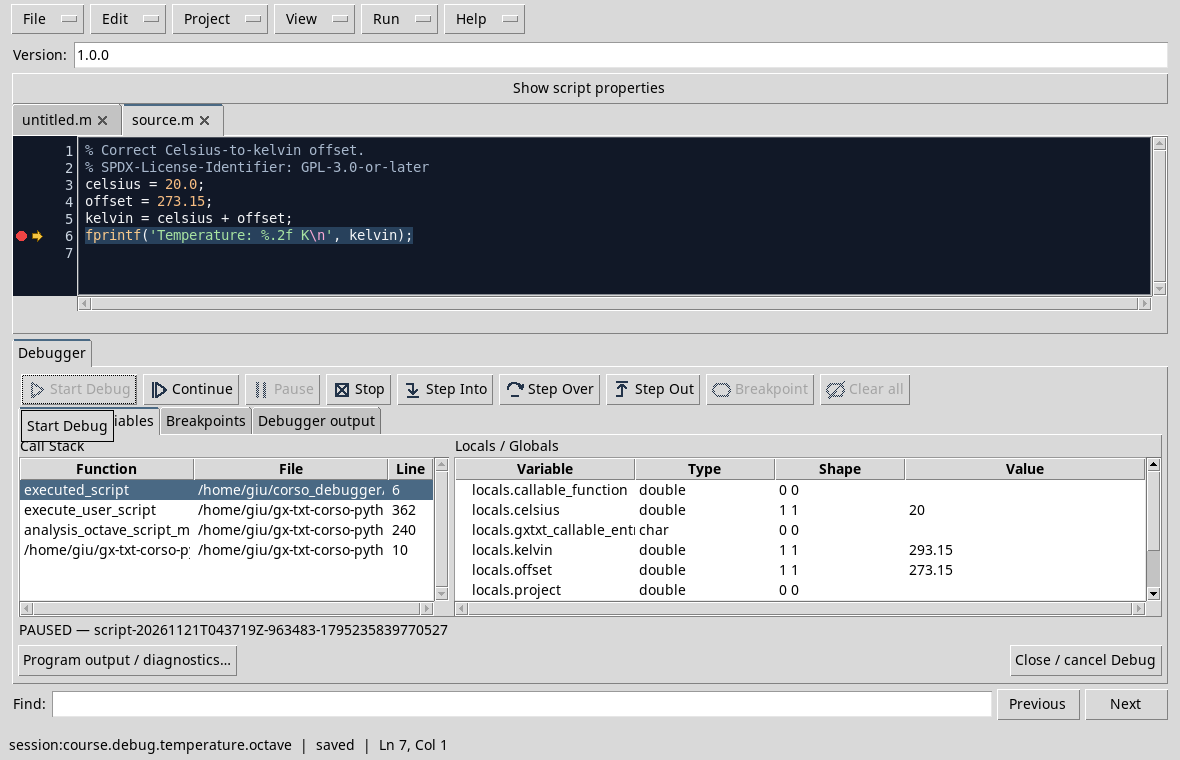
Do not confuse the two symbols: the arrow changes with the selected frame while the breakpoint is a point set on the source. In a file with foldable functions or blocks, folding arrows allow you to close the text without modifying it. The numbering continues to refer to the physical lines: the hidden rows are not erased.
Exercise
If a function occupies the 20 – 30 rows and is folded, the next line physically becomes the 21?
Worked solution
No. Filling changes the display: the following row remains the 31, if this was its location in the file. To change the source, you need to change it and save it.
Course index · Previous lesson
D08 — Adding and removing breakpoints
Breakpoints should be placed on executable lines, not on comments. We use the temperature_fixed.m example already registered in the test Session.
Use the gutter or F9
With no Debug Job active, click the gutter next to kelvin = celsius + offset: the full red point indicates that the breakpoint was added. A second click on the same location removes it. Alternatively, place the cursor on an executable row and press F9 to alternate addition and removal.
Try clicking next to a comment. In the copy used for the GX-TXT guide, the line is not an executable instruction and does not create a breakpoint:
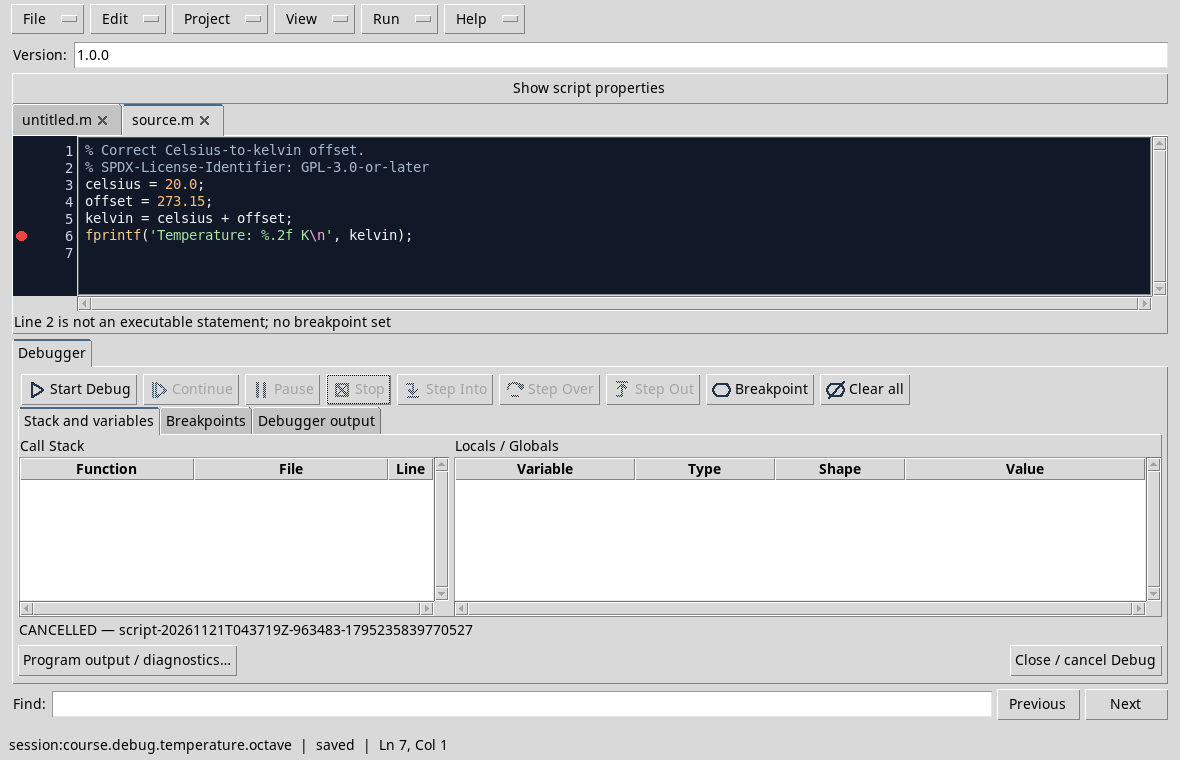
The number in the message relates to the physical line. If a point does not appear, check before the line actually contains an instruction, that the script is saved and that there is no active debug Job.
Exercise
Add one point on the sum and another on the print. How many remain if you click the sum again?
Worked solution
There’s one left in the print statement. You can check it in the Breakpoints panel before starting a new test.
Course index · Previous lesson
D09 — Enabling and disabling breakpoints
Disable a breakpoint keeps its location on the list, but does not use it to stop the program. It is useful when we want to temporarily skip a stage without rebuilding all points.
Two points, one active
In the temperature_fixed.m script, set points on the sum and print rows while the debugger is inactive. Open the Breakpoints tab, select the sum row and press Disable. The Enabled column passes to no; in the gutter the point becomes an empty red circle. The point on the press remains full and active.
Start Start Start Debug. In the test the program exceeds the disabled point and stops on the active one of the press:
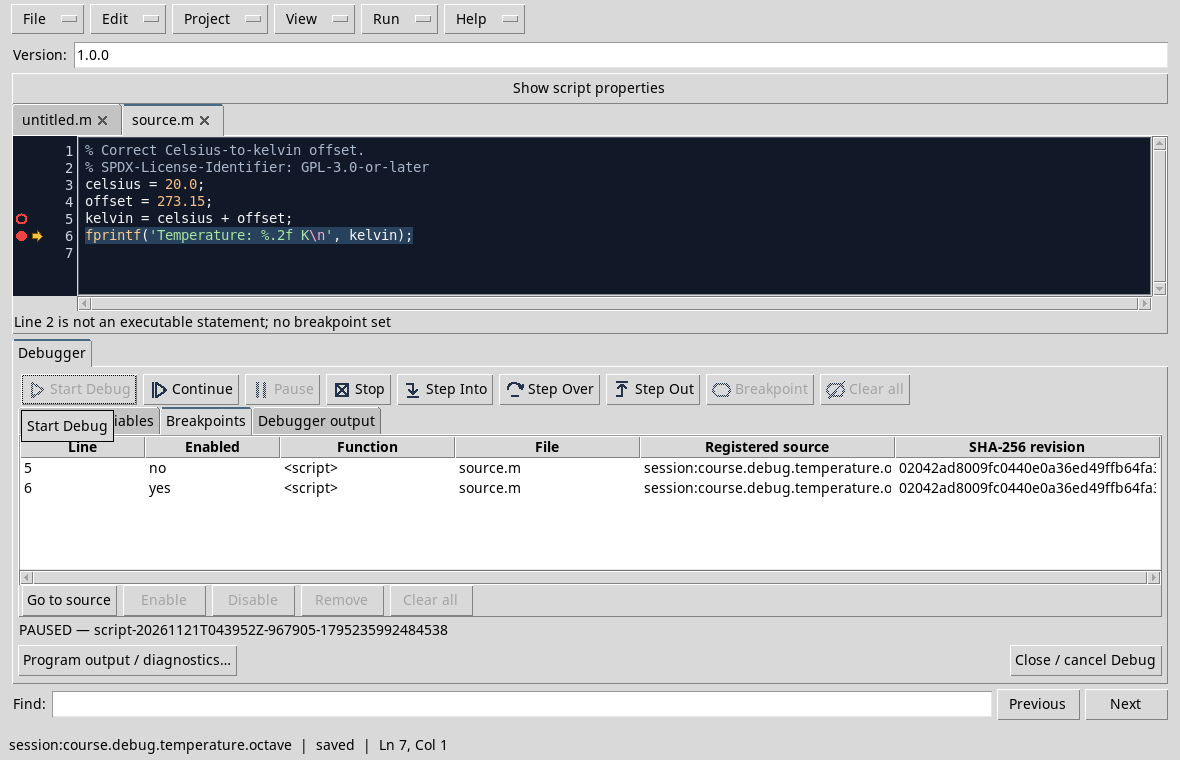
End Job with Continue. To reuse the first point, select it and press Enable when the Job is finished. The list and controls show what changes are available in the current state.
Exercise
If the sum is disabled, does it mean that the sum is not executed?
Worked solution
No. The line is executed normally; the debugger does not stop there for that breakpoint. In the test the kelvin value is already available when we reach the print statement.
Course index · Previous lesson
D10 — Managing a list of breakpoints
The Breakpoints panel helps to revise only the set points in one place and review the source to which they refer.
Read and manage the list
With the inactive debugger, set two points in the temperature_fixed.m script: one on the sum, one on the print statement. Open the Breakpoints tab. The test shows the 5 and 6 lines, the Enabled status, the file and identity of the registered source:
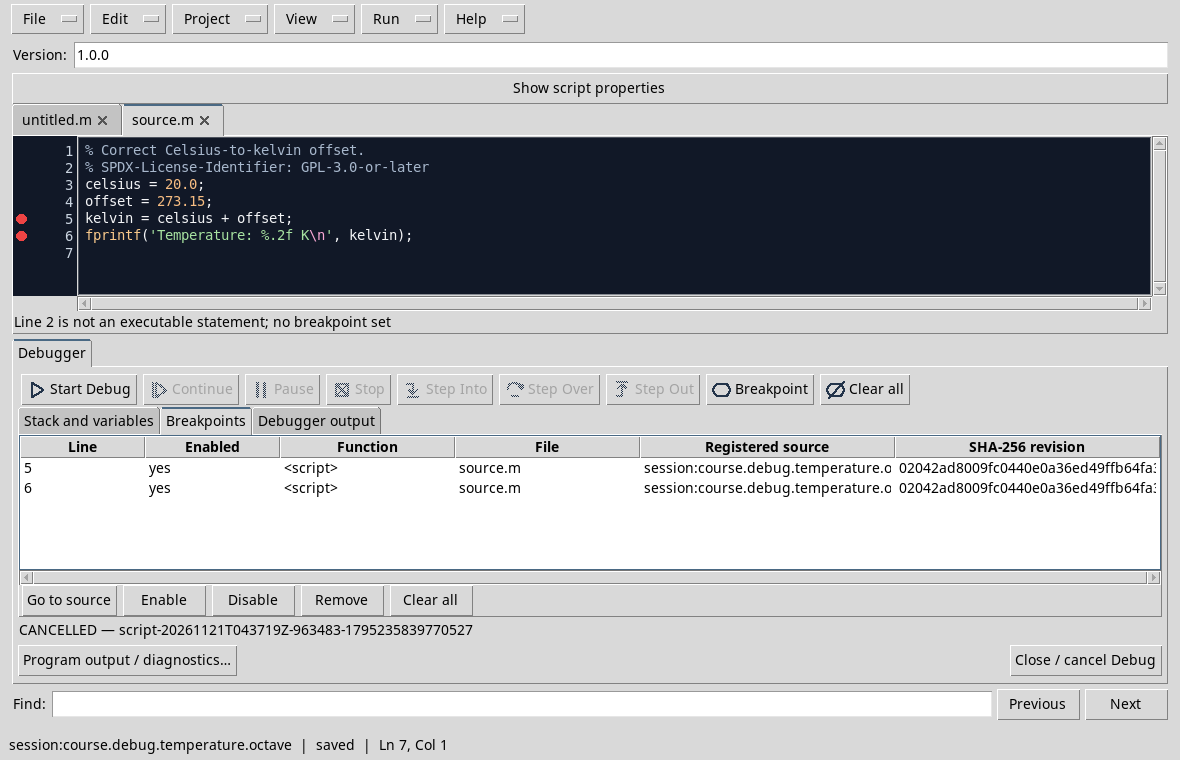
Select a row to use Go to source, Enable, Disable or Remove. Remove removes the selected point; Clear all deletes all editable breakpoints. Check the list before you start: choosing points in advance makes it clearer where we expect to stop.
During a Debug Job managed points editing commands are disabled: it ends or cancels the test first. This rule avoids confusing the revision already running with a new configuration.
Exercise
You disabled a point to use it later. What command keeps the location: Disable or Remove?
Worked solution
Disable keeps the item on the list. Remove it; to use it again you will have to add it.
Course index · Previous lesson
D11 — Saved source and execution snapshots
When you start a Debug Job, GX-TXT uses the registered revision of the script. The text that subsequently modifies the editor and the snapshot already running are two distinct things.
Observe a change during the break
In the Test Session, use temperature_fixed.m, save the copy and start the debug with a breakpoint on the print statement. While Job is on break, temporarily change a row to the editor buffer. In the test we removed the point and comma from the offset line.
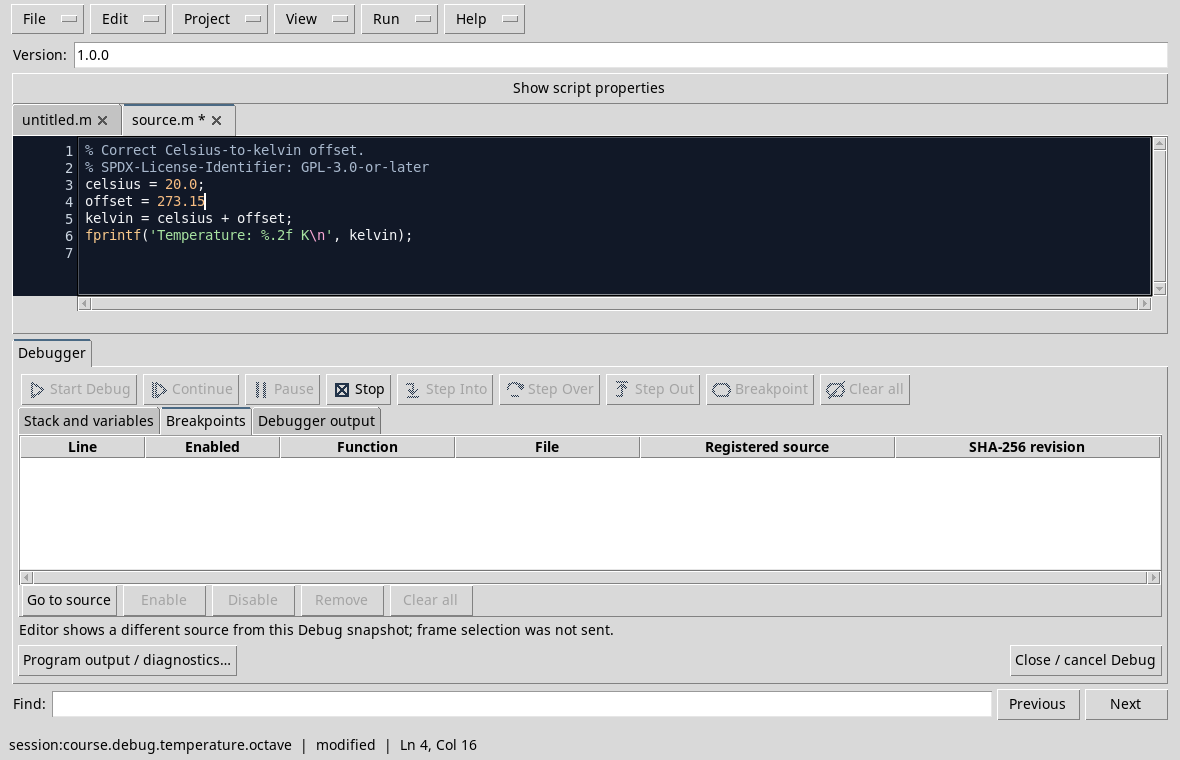
The source card shows an asterisk and the status bar indicates modified. The debugger message reports that the editor shows a different source from the snapshot; the forward commands on the source are not available in this situation. The buffer change does not retroactively change the program already started.
Back to a coherent situation
Press Stop to finish the active test. Restore the desired and saved text. Changing the source invalidates the previous breakpoint positions: check the list and set them back to the version you want to run.
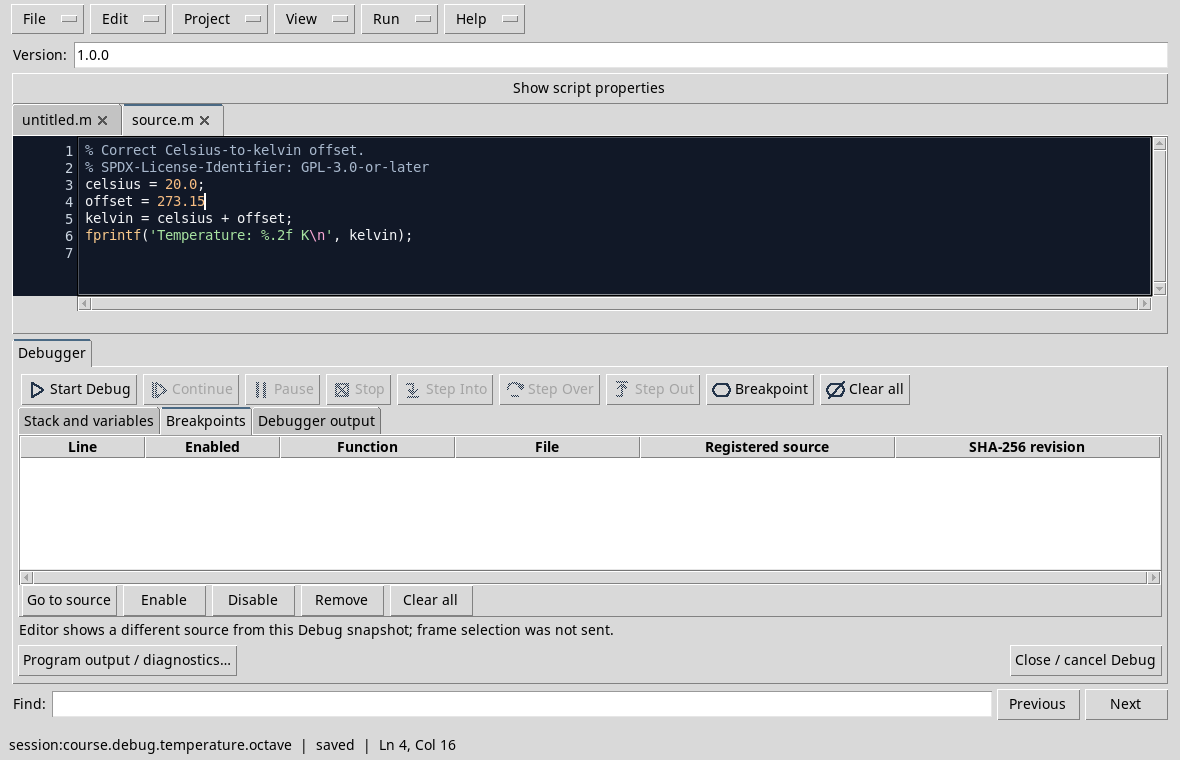
Keep a copy of your work before changing Session or closing the editor avoids losing unsaved changes. The snapshot offers a consistent reference to interpret what the Job has actually performed.
Exercise
Modify a value in the editor while a Job is already steady. Does that value change the calculation already started?
Worked solution
No. The Job continues to refer to the snapshot captured when the Job started. End the test, save the desired source and start a new Job with controlled breakpoints.
Course index · Previous lesson
D12 — Restrictions during an active Job
An active Debug Job has its own snapshot and breakpoint configuration defined at startup. The viewer controls show what actions are available in each state.
Compare commands before and during break
With the saved copy of temperature_fixed.m, set two points on the sum and print. Disable the first and start Start Debug. In the Octave test the program stops on the print statement, the active point.
While the Job is active, the commands to change the list are disabled. You can inspect the status and use the allowed controls, such as Continue or Stop, but to change enabled or positions finish the test first. If you change the source in the editor while Job is on break, see the D11: the modified text does not become the snapshot already started.
Repair a test
Press Continue to complete or Stop to cancel. When the status becomes terminal, select the desired point in the list and change the configuration. Start a new Debug Job and check the line on which it stops. Do not attribute the behavior of a breakpoint test changed only after its start.
Exercise
You want to disable a point that is active in Job on break. What steps do you take?
Worked solution
Complete or cancel the current Job, disable the point in the list when the check is available and start a new test. The previous Job remains associated with its configuration.
Course index · Previous lesson
Once the breakpoints are fixed, the next step is to decide how to cross a call and in which frame read the variables.
Previous: Module 01 · 10-module course contents · Next: Module 03
Other steps of this project
- Debugging GNU Octave in GX-TXT: Breakpoints, Variables and Public APIs
- GX-TXT Debugger · Module 08 — Projects, revisions and Sessions
- GX-TXT Debugger · Module 09 — Integrated practical cases
- GX-TXT Debugger · Module 10 — Independent debugging and the final project
- GX-TXT Debugger · Guide 05 — Debugging scientific data: vectors, structures and Datasets
- GX-TXT Debugger · Guide 06 — Debugging a complete scientific workflow