
GNU Octave with GX-TXT — Lesson 08: Scientific Plots and Debugging
Written by Giux |
Published on Nov 6, 2026 |
No comments
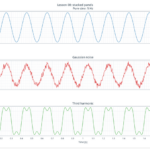
Learn how to create scientific plots using GNU Octave and GX-TXT’s public APIs. In Lesson 08, we compare three sine-wave signals using overlaid curves and stacked panels, then explore the built-in Octave debugger to identify and fix an intentional programming error using breakpoints, local variables, and managed script execution.