Source and orientation
What you can analyse
Open Viewers, search for Statistical Analysis and click the viewer card. To run an analysis you need an open Session and at least one canonical scientific Dataset. If you open the viewer without a Session, Scientific Dataset is empty, the top menu shows Help and an attempt to run reports Interactive Document API requires an open Session. Open a Session from the main window and reopen the viewer. Use the left panel for the source, the method and the parameters. The central pane is reserved for the source. The text area at the bottom changes with the provider description, the analysis receipt, the numeric preview and the inspection. The status line is below the text.
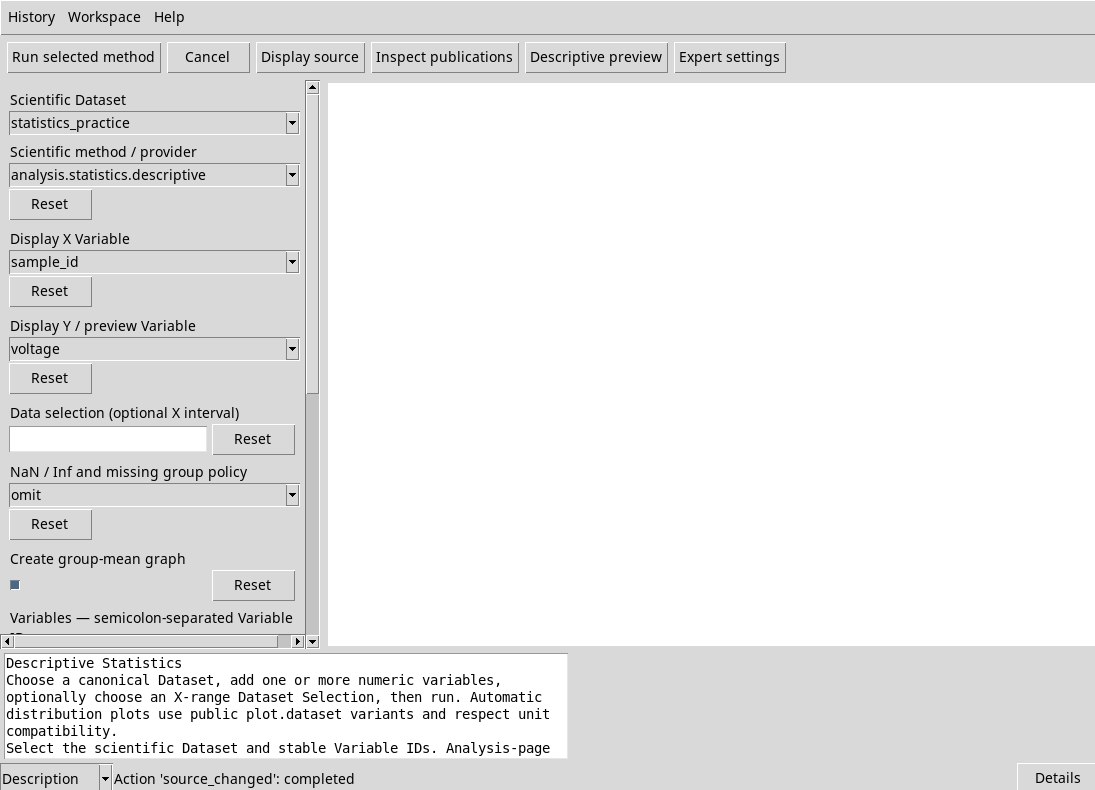
The Scientific method / provider selector shows the IDs of the installed analyses. The list of fields changes with the method. When you change provider, check the variables, the shared choices and the output ID again before running. Labels are kept exactly as they appear in the window. The description at the bottom gives the full name of the provider.
Importing the practice Dataset
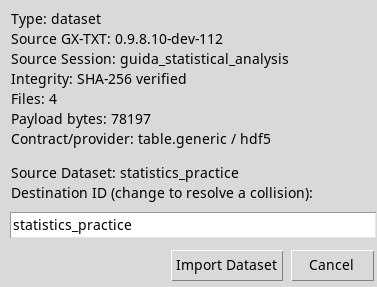
- Download statistics_practice.gxtxt-dataset.zip. Open a test Session in the main window.
- In Dataset, open Actions → Import Dataset ZIP…. Choose the ZIP and check the integrity in the import window. Leave the Destination ID a
statistics_practiceas it is to follow the examples. If it is already taken by other data, use an empty Session or assign a new ID and select that ID in every exercise. - Press Import Dataset and confirm the success message. In the viewer open Scientific Dataset and choose
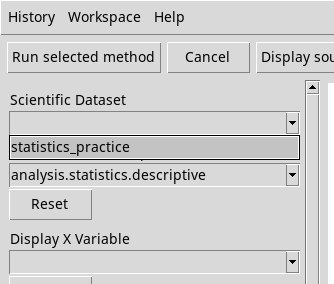
statistics_practice. Opening the list after the import refreshes the options. The enabled columns become available in the variable selectors. In the text fields that take lists, use the exact IDs.
The readable CSV describes the 18 synthetic rows. The ZIP also keeps types and units. sample_id runs from 1 to 18. voltage has means of 10, 13 and 16 V in groups site A, B and C, also coded as group 1, 2 e 3. response roughly follows twice voltage. influence matches voltage except for the last value, 60 V. weight is dimensionless and u_voltage holds uncertainties in V. incomplete contains two NaN values, bad_group one NaN in the numeric category and constant 18 values equal to 7 V.
Showing and checking the source
For Display source choose two numeric source variables in Display X Variable e Display Y / preview Variable. The example uses sample_id for X and voltage for Y. The command binds the data to the central pane. In the pane the wheel adjusts the zoom, dragging with the middle button moves the view and a left double-click fits the extent again. In the verified release, however, the pane can stay white with Action 'plot': completed. In this state moving around can change the internal view without drawing axes or a trace. To inspect the measurements use the Dataset page of the main window or the numeric preview command below.
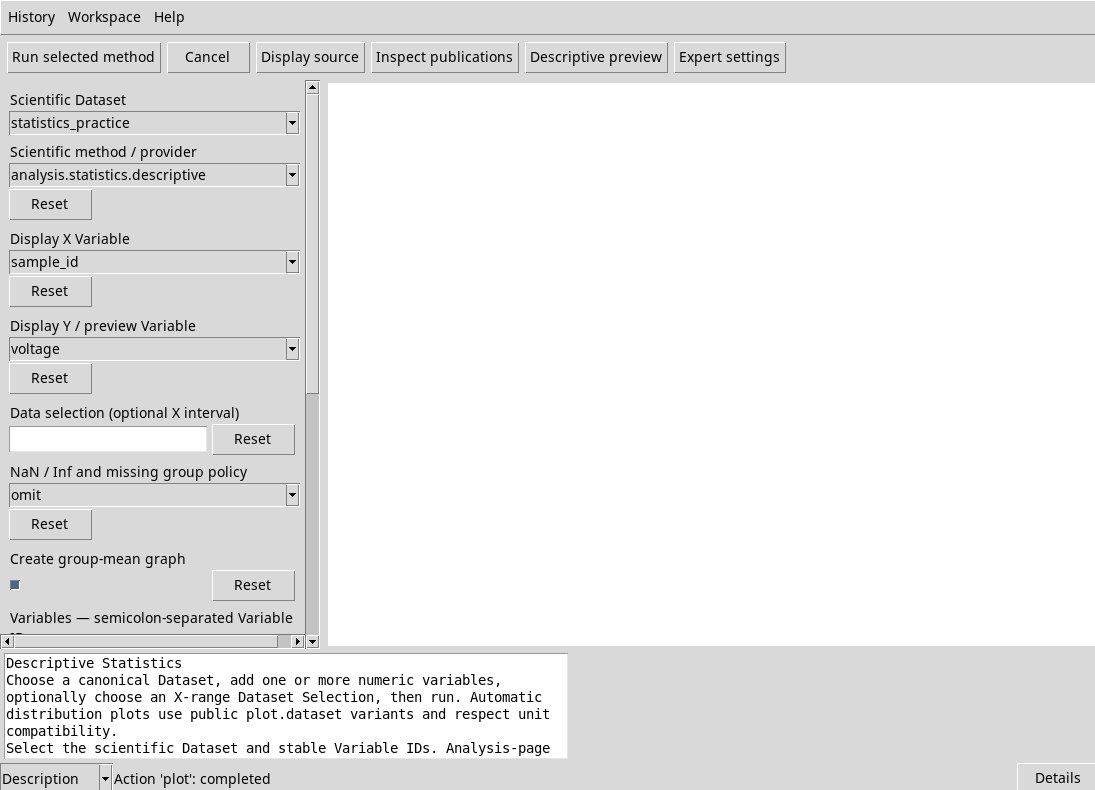
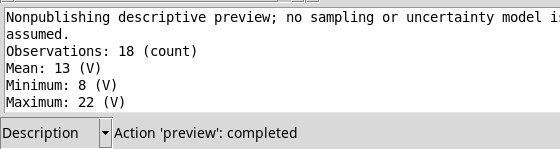
Descriptive preview uses only Display Y / preview Variable. Select voltage and press the button. Read the valid count, mean, extremes, median and the sample and population standard deviations in the text area at the bottom. The test returns 18 observations, mean 13 V and median 12.5 V. The preview omits NaN/Inf. It is a quick calculation over the whole column, with no publication and no uncertainty model. The analysis fields and the axis variables have independent roles.
Changing a field and resetting it
Use the decimal point for numeric values. After typing a value, leave the field before moving to the next one. Reset acts on the field next to it. For example, set Histogram normalization a density and press its Reset to go back to count. In fields with a shared configuration, check the value shown after the reset and compare it with the provider choices. Resetting the display variable selectors goes back to the empty choice.
Opening the built-in guide and the module information
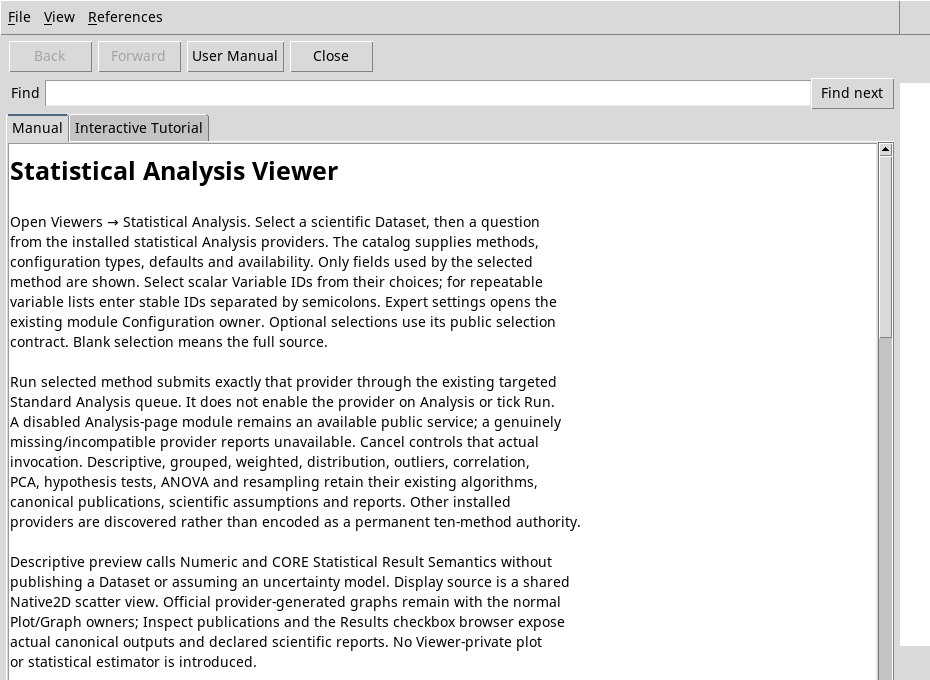
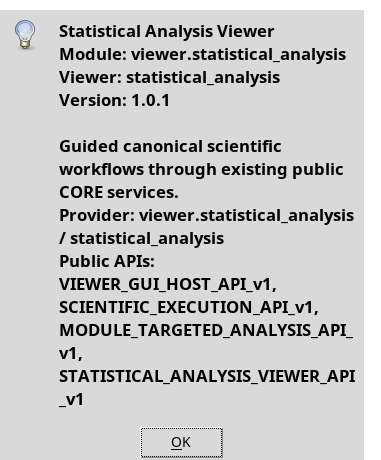
Help → User Manual…, also with F1, opens the viewer manual. Help → About Module… shows information about the active module in a window that you close with OK. This guide was verified with viewer 1.0.1 in GX-TXT 0.9.8.10-dev-112-r2 with patch P011-bis. Because of an error in the patch name, the program reports it as p011.