

One-way ANOVA
Comparing the means of several groups
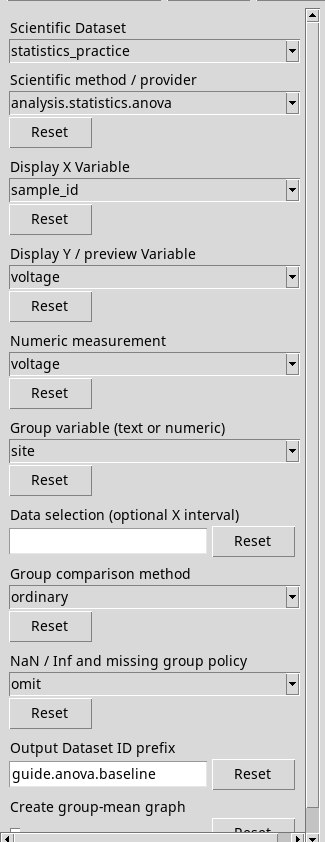
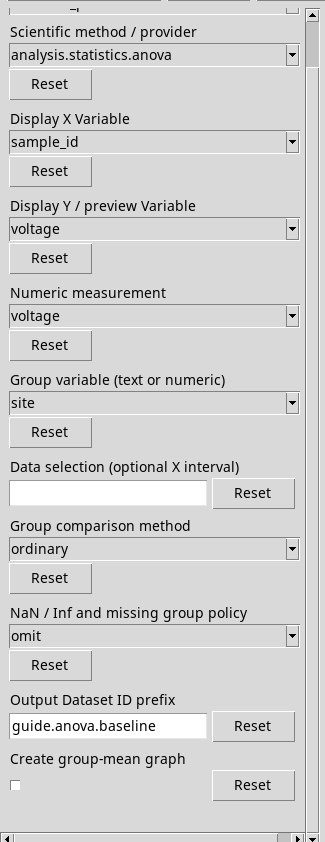
Choose analysis.statistics.anova. In Numeric measurement put voltage. In Group variable (text or numeric) put site o group. Select ordinary in Group comparison method, prefix guide.anova.baseline and plots disabled. The analysis uses a single factor.
The provider’s initial output prefix is statistics.anova. The exercise uses a dedicated name.
Configuration in the GUI
Common variance or distinct variances
- ordinary
- This is the initial choice. It uses the ratio of the between-group mean square to the within-group mean square. It assumes independent and Gaussian observations within each group, with a common variance.
- welch
- Allows distinct variances, and requires at least two valid observations and a positive variance in every group. It uses approximate statistics and degrees of freedom. The synthetic measurements show different dispersions, so it is instructive to repeat the run with
welch. - NaN / Inf and missing group policy
- Here
omitdiscards the rows with a non-finite measurement or an invalid group.errorstops the processing in either case. Check Selected e Valid in the report. - Create group-mean graph
- Enable it to get the graphical comparison variant of the means. Also consult the counts and dispersions of
.groups.
Choices of other providers. The shared menu may also show bootstrap, independent_t, iqr, mad, mann_whitney, one_sample_t, paired_t, permutation_independent, permutation_paired, signed_rank, welch_t. Each one is rejected before this method starts. Go back to one of the choices described here and press Run selected method.
Reading groups and the overall result
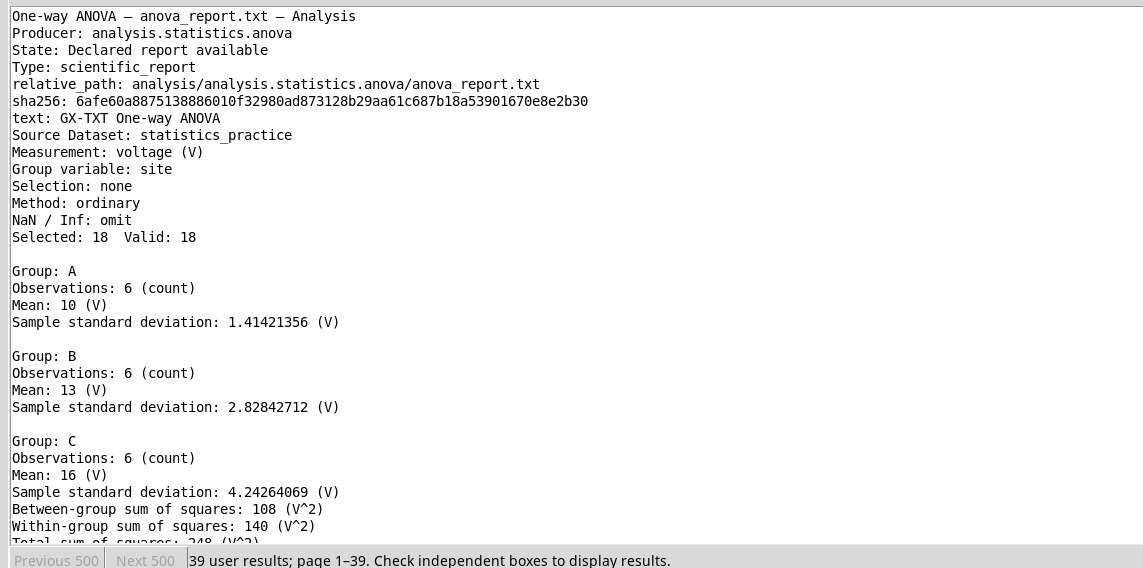
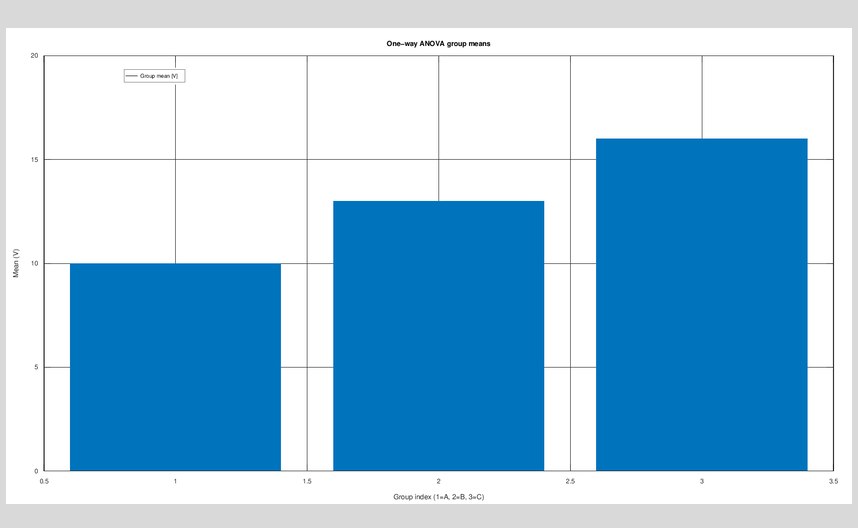
Read .groups for index, label, count, mean, variance and standard deviation. Read .test o anova_report.txt for between/within/total sums of squares, degrees of freedom, F, p and effect statuses. For the ordinary run the means are 10, 13 and 16 V, F(2, 15) ≈ 5,786 e p ≈ 0.0137. The sums of squares are 108 and 140 V², for a total of 248 V².
The overall test concerns the equality of the means. The output of this method stops at the overall result, so identifying pairs of groups requires an appropriate post-hoc procedure. The observed eta squared is 108/248 ≈ 0.435. Omega squared, here about 0.347, corrects for the residual variability and can even be negative. In the Welch variant on the same measurements, F ≈ 6,639 e p ≈ 0.0185. The classic effects are unavailable for Welch. With zero within-group variance, check the inference status in the report.
Result in the GUI
Plot in Plots
For output IDs, selection and publishing criteria see Options shared by the providers. To look up or open the result go to Tables, reports and plots.