

Grouped statistics
Comparing summaries by category
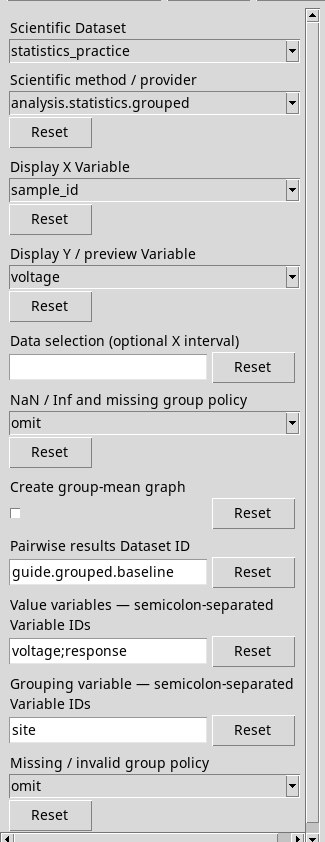
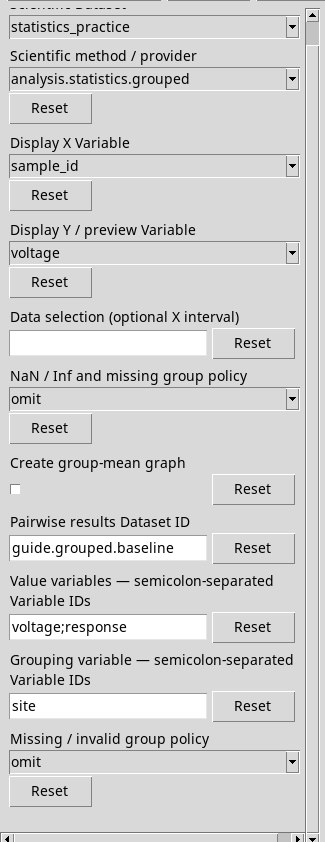
Choose analysis.statistics.grouped. Type voltage;response in Value variables — semicolon-separated Variable IDs e site in Grouping variable — semicolon-separated Variable IDs. Write guide.grouped.baseline in the output ID field. Leave both policies at omit and untick the plots for the first run.
The provider’s initial output ID is statistics.grouped.summary. The exercise uses a dedicated name.
Configuration in the GUI
Variables, groups and invalid rows
- Value variables — semicolon-separated Variable IDs
- Enter at least one numeric ID. A list produces a summary for each group × variable pair. If the units belong to different families, the plot series are split by compatibility.
- Grouping variable — semicolon-separated Variable IDs
- Enter a single ID.
siteuses the text labels A, B, C.groupuses the exact numeric values 1, 2, 3. Each distinct numeric value defines a category. Before using a continuous variable for grouping, encode consistent classes in a column prepared for that purpose. - Missing / invalid group policy
omit(initial) excludes the whole row without a valid group and counts it outside all categories.errorstops the procedure. Trybad_group, which contains a NaN in the group. The common NaN/Inf policy for the measurements instead affects the count of each group × measurement pair.- Create group-mean graph
- Enable it for the grouped variants published by the provider. Leave it off to consult the table and report without rendering.
Reading group and metric
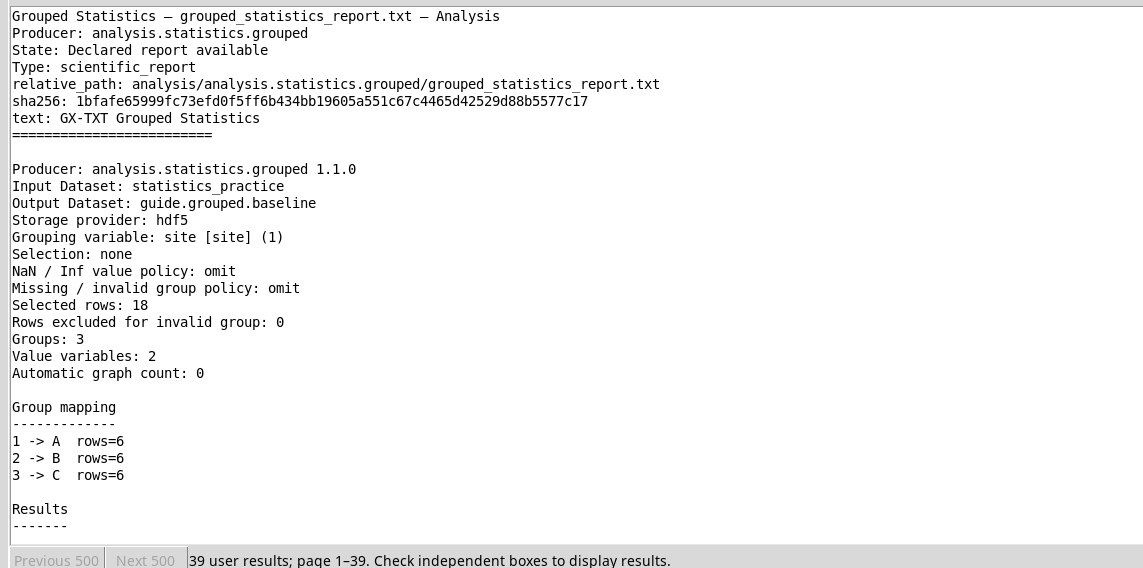
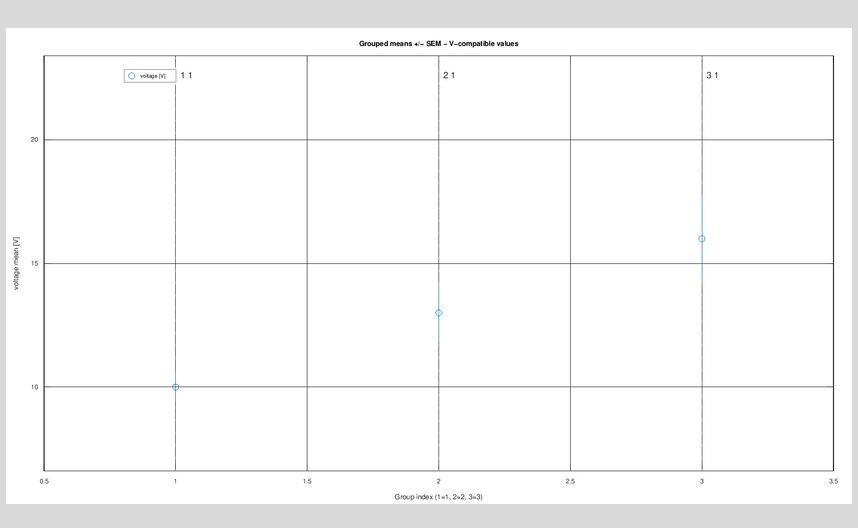
In the report grouped_statistics_report.txt you find three groups of six rows. The means of voltage are 10, 13 and 16 V. The sample standard deviations, 1.414, 2.828 and 4.243 V respectively, show that the dispersion grows. The initial map links the assigned index and the original label. In the summary Dataset each combination has counts and statistics with units. The standard error requires independence within the group.
To formulate an inferential comparison of the group means use One-way ANOVA and assess the assumptions on the variances. The summaries in this chapter describe the observed groups.
Result in the GUI
Plot in Plots
For output IDs, selection and publishing criteria see Options shared by the providers. To look up or open the result go to Tables, reports and plots.