

Outliers
Flagging extreme observations
Choose analysis.statistics.outliers. In Numeric variable select influence, in Group comparison method choose iqr. Set Fence or robust-score threshold a 1.5 and output ID guide.outliers.baseline. Run and open outliers_report.txt.
The provider’s initial output ID is statistics.outliers.flags. The exercise uses a dedicated name.
Configuration in the GUI
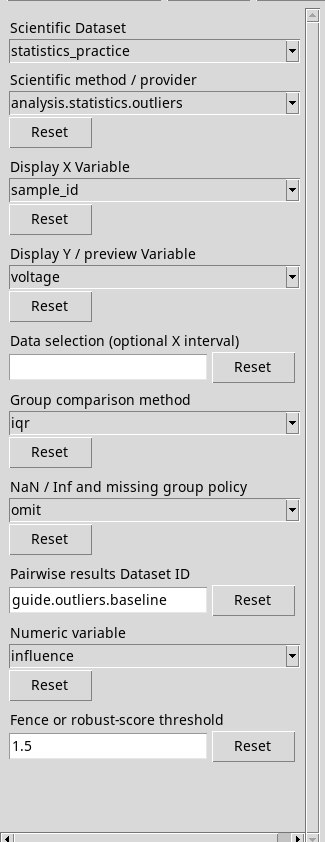
Two robust scales
- iqr
- Initial method. The limits are Q1 − k × IQR and Q3 + k × IQR. The IQR is Q3 − Q1. The score is the deviation from the median divided by the IQR.
- mad
- Uses the MAD, the median of the absolute deviations from the median, scaled for consistency under a normal model. The limits are the median plus or minus k times this scale. The score is the signed deviation divided by the scale. Try
3.5and compare the limits. - Fence or robust-score threshold
- Enter a positive dimensionless multiplier, initially 1.5. For the same method a larger threshold makes the flag more selective. If the scale is zero, the points equal to the median have score 0 and the deviations have infinite score with their sign. Use the limits to decide whether to flag the value.
Choices of other providers. The shared menu may also show bootstrap, independent_t, mann_whitney, one_sample_t, ordinary, paired_t, permutation_independent, permutation_paired, signed_rank, welch, welch_t. Each one is rejected before this method starts. Go back to one of the choices described here and press Run selected method.
Per-row result
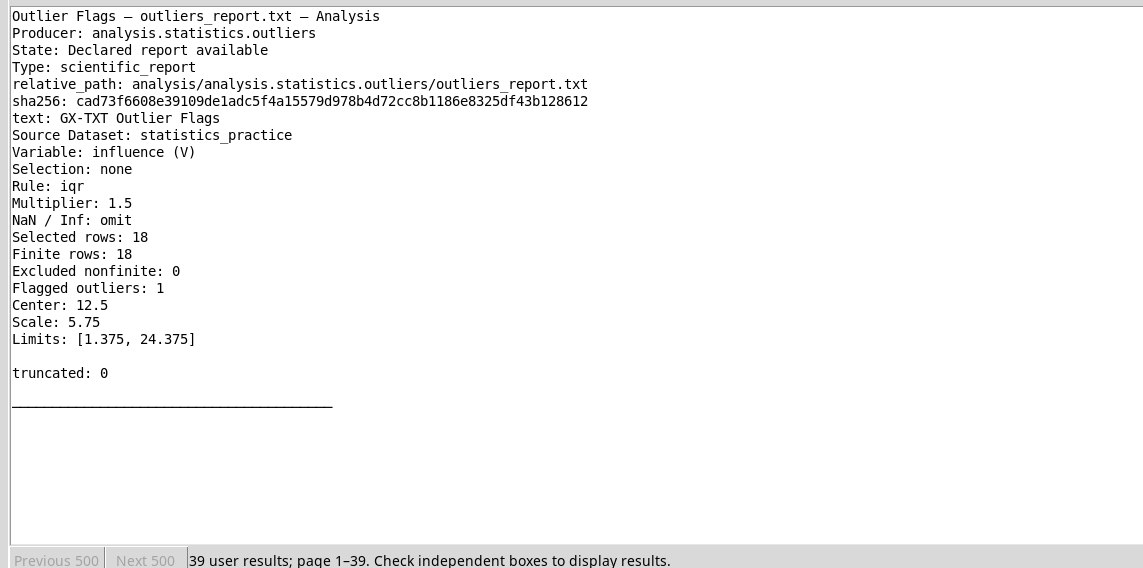
With iqr the report shows one flagged value and limits 1.375–24.375 V. In the Dataset look for the row with is_outlier=1. source_row=18: it identifies the value 60 V. Each selected row keeps the original one-based index, the measurement, the method, the signed score, the limits and the 0/1 flag. With omit a non-finite row stays in the table with score NaN and flag 0, and is counted separately.
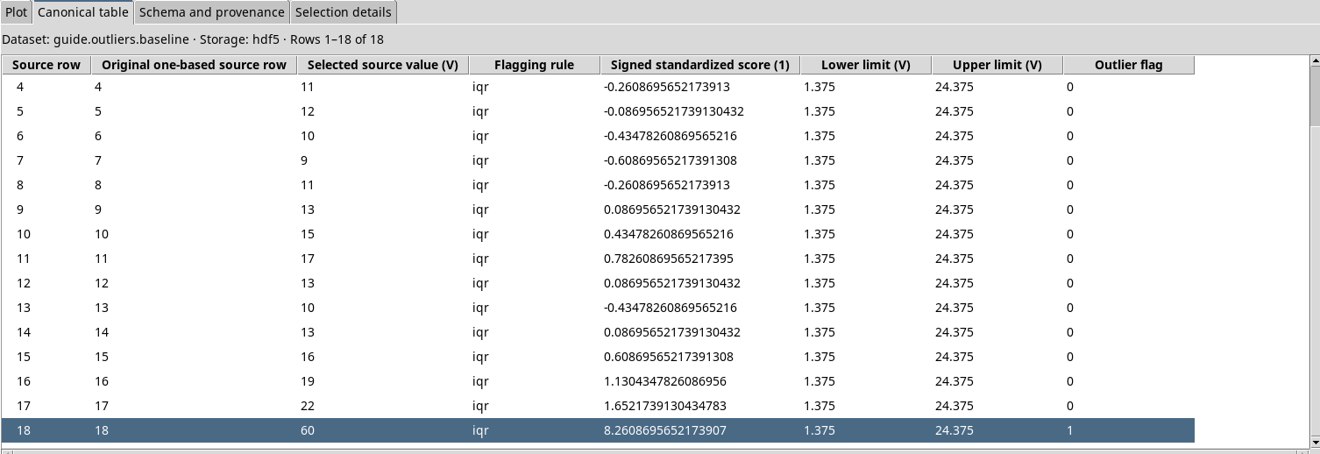
The flag indicates that the value exceeds the limits of the chosen rule. Examine the measurements and the experimental procedure before excluding a row. With different groups or regimes it is also useful to check the distributions by group.
Result in the GUI
For output IDs, selection and publishing criteria see Options shared by the providers. To look up or open the result go to Tables, reports and plots.