

Hypothesis tests
Comparing a mean, two samples or pairs
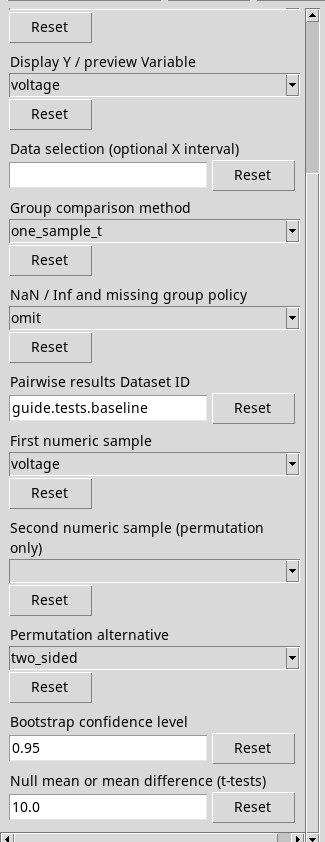
Choose analysis.statistics.tests. For the initial run set Group comparison method to one_sample_t e First numeric sample to voltage. Leave the second sample empty. Set Null mean or mean difference (t-tests) a 10, alternative two_sided, confidence 0.95 and ID guide.tests.baseline. All the numbers of the run refer to the synthetic table.
The provider’s initial output ID is statistics.tests.result. The exercise uses a dedicated name.
Configuration in the GUI
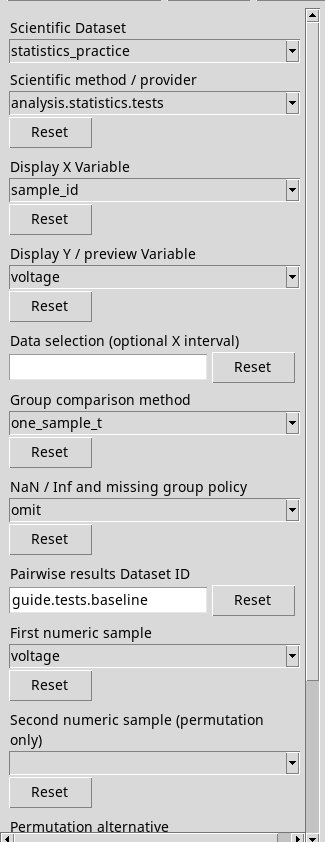
Choosing the test according to the design
- one_sample_t
- Compares the mean of the first column with μ0. The classic t model requires independent measurements and Gaussian sampling.
- independent_t
- Compares the means of independent samples with a common variance. The denominator uses a pooled estimate of the variance. The row positions of the two columns may have independent meanings.
- welch_t
- Compares independent means with potentially different variances. Degrees of freedom and inference are approximate. The report leaves undefined the standardised effect provided for the other t-tests.
- paired_t
- Computes a t-test on the first − second differences row by row. Check that the measurements are really paired and that the differences are independent across pairs. The Gaussian condition concerns the differences.
- mann_whitney
- Compares the ranks of the two independent samples. An interpretation as a difference in location requires assumptions on the shape of the distributions. A difference in ranks may also reflect a difference in shape.
- signed_rank
- Uses rank and sign of the paired differences. The interpretation as a location test requires symmetry of the differences. Zero differences are excluded from the signed-rank component.
For every two-sample method select the second column in Second numeric sample (permutation only), even when the label says “permutation only”. Use response to practise. This pair of columns is measured on the same row. The examples with independent tests serve to observe the behaviour of the command in a synthetic run, while the paired example reflects the row relationship. The units must be compatible and the second column is converted into the unit of the first.
Choices of other providers. The shared menu may also show bootstrap, iqr, mad, ordinary, permutation_independent, permutation_paired, welch. Each one is rejected before this method starts. Go back to one of the choices described here and press Run selected method.
Direction, confidence and null reference
- Permutation alternative
- The label is shared. Here
two_sided(initial) considers both directions.greaterlooks towards larger values andlesstowards smaller values than the reference mean or difference, or in the corresponding direction of the ranks. Choose the direction before reading the result. - Bootstrap confidence level
- In the method of this chapter it is the level for the t-test interval. Use a number strictly between 0 and 1, for example
0.95o0.90. The one-sided interval has an infinite endpoint. The shift interval for the rank tests is unavailable. - Null mean or mean difference (t-tests)
- The initial value is 0. It gives the reference mean in the one-sample case and the reference first − second difference in the other t-tests. It is expressed in the unit of the first variable. Reset it to zero for the rank tests.
Reading estimate, evidence and precision
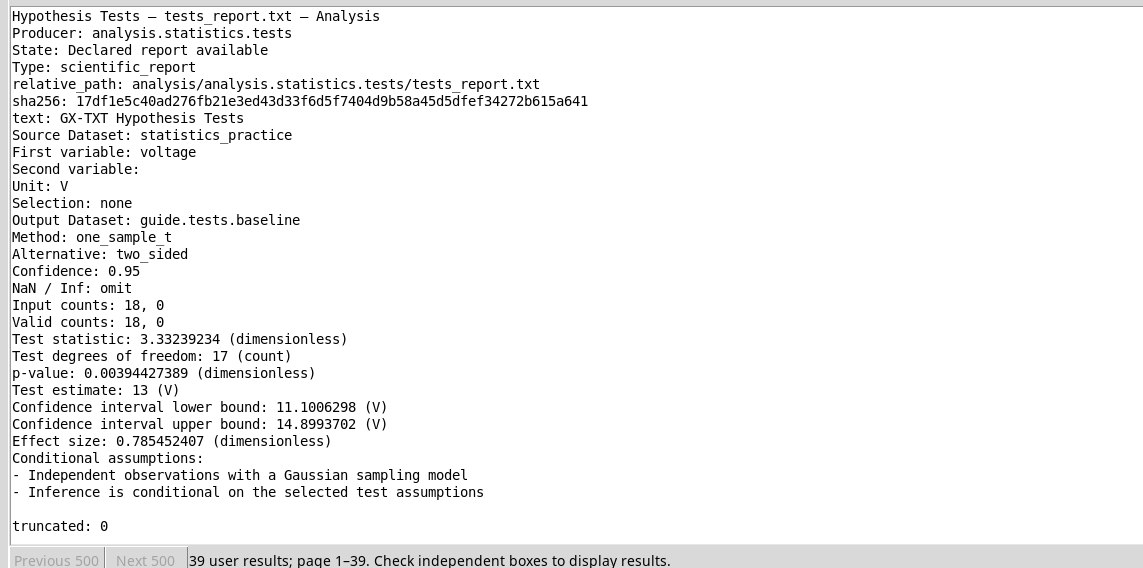
In tests_report.txt you find estimate 13 V, t ≈ 3.332, 17 degrees of freedom, p ≈ 0.00394 and a two-sided 95% interval from 11.101 to 14.899 V. The p-value quantifies how unusual an outcome at least this extreme would be, assuming the null hypothesis and the test model. The interval concerns the precision according to the sampling procedure. The effect, here Cohen d ≈ 0.785, expresses the deviation on a standardised scale.
The table contains method, initial and valid sizes, estimate, statistics, alternative, interval, effect and approximation. In the rank tests the effect is the rank-biserial correlation. Up to 20 relevant observations the calculation uses exact conditional distributions. For larger sizes it uses a normal approximation corrected for tied ranks and continuity. Constant variance or differences may leave inference and interval undefined while still allowing the point estimate.
Result in the GUI
For output IDs, selection and publishing criteria see Options shared by the providers. To look up or open the result go to Tables, reports and plots.